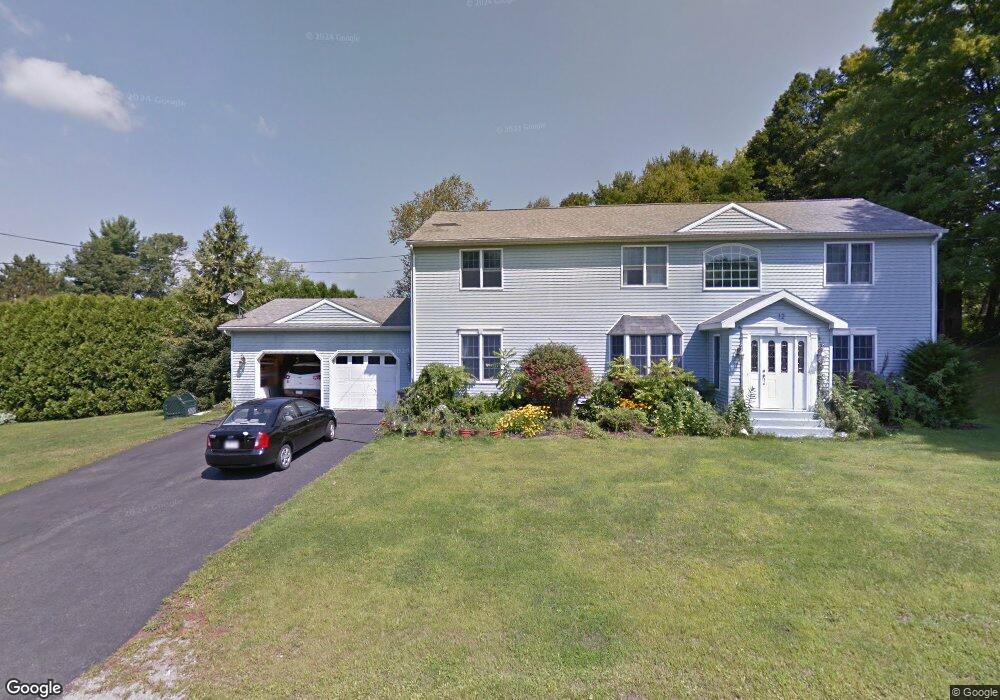
12 Otis St Pittsfield, MA 01201
Estimated Value: $525,000 - $651,795
5
Beds
4
Baths
3,153
Sq Ft
$185/Sq Ft
Est. Value
About This Home
This home is located at 12 Otis St, Pittsfield, MA 01201 and is currently estimated at $583,449, approximately $185 per square foot. 12 Otis St is a home located in Berkshire County with nearby schools including Robert T. Capeless Elementary School, John T. Reid Middle School, and Taconic High School.
Ownership History
Date
Name
Owned For
Owner Type
Purchase Details
Closed on
Jun 27, 2018
Sold by
Quinto Jeffrey A and Quinto Angela S
Bought by
Melendez Heather M and Parise Matthew
Current Estimated Value
Home Financials for this Owner
Home Financials are based on the most recent Mortgage that was taken out on this home.
Original Mortgage
$285,300
Outstanding Balance
$242,074
Interest Rate
3.88%
Mortgage Type
New Conventional
Estimated Equity
$341,375
Purchase Details
Closed on
May 18, 2015
Sold by
Bennett Josh A and Jennings Jennifer K
Bought by
Quinto Jeffrey A and Quinto Angela S
Home Financials for this Owner
Home Financials are based on the most recent Mortgage that was taken out on this home.
Original Mortgage
$264,575
Interest Rate
3.69%
Mortgage Type
New Conventional
Purchase Details
Closed on
Jul 24, 2012
Sold by
Gillette Heather L and Gillette Jeral R
Bought by
Bennett Josh A and Jennings Jennifer K
Create a Home Valuation Report for This Property
The Home Valuation Report is an in-depth analysis detailing your home's value as well as a comparison with similar homes in the area
Home Values in the Area
Average Home Value in this Area
Purchase History
| Date | Buyer | Sale Price | Title Company |
|---|---|---|---|
| Melendez Heather M | $317,000 | -- | |
| Quinto Jeffrey A | $278,500 | -- | |
| Bennett Josh A | $279,900 | -- |
Source: Public Records
Mortgage History
| Date | Status | Borrower | Loan Amount |
|---|---|---|---|
| Open | Melendez Heather M | $285,300 | |
| Closed | Melendez Heather M | $285,300 | |
| Previous Owner | Quinto Jeffrey A | $264,575 |
Source: Public Records
Tax History
| Year | Tax Paid | Tax Assessment Tax Assessment Total Assessment is a certain percentage of the fair market value that is determined by local assessors to be the total taxable value of land and additions on the property. | Land | Improvement |
|---|---|---|---|---|
| 2025 | $8,929 | $497,700 | $68,400 | $429,300 |
| 2024 | $8,000 | $433,600 | $68,400 | $365,200 |
| 2023 | $7,249 | $395,700 | $63,400 | $332,300 |
| 2022 | $6,567 | $353,800 | $60,900 | $292,900 |
| 2021 | $6,462 | $335,700 | $60,900 | $274,800 |
| 2020 | $6,492 | $329,400 | $60,900 | $268,500 |
| 2019 | $5,991 | $308,500 | $55,400 | $253,100 |
| 2018 | $6,047 | $302,200 | $55,400 | $246,800 |
| 2017 | $5,708 | $290,800 | $53,400 | $237,400 |
| 2016 | $5,624 | $299,800 | $53,400 | $246,400 |
| 2015 | $5,185 | $287,100 | $53,400 | $233,700 |
Source: Public Records
Map
Nearby Homes
Your Personal Tour Guide
Ask me questions while you tour the home.