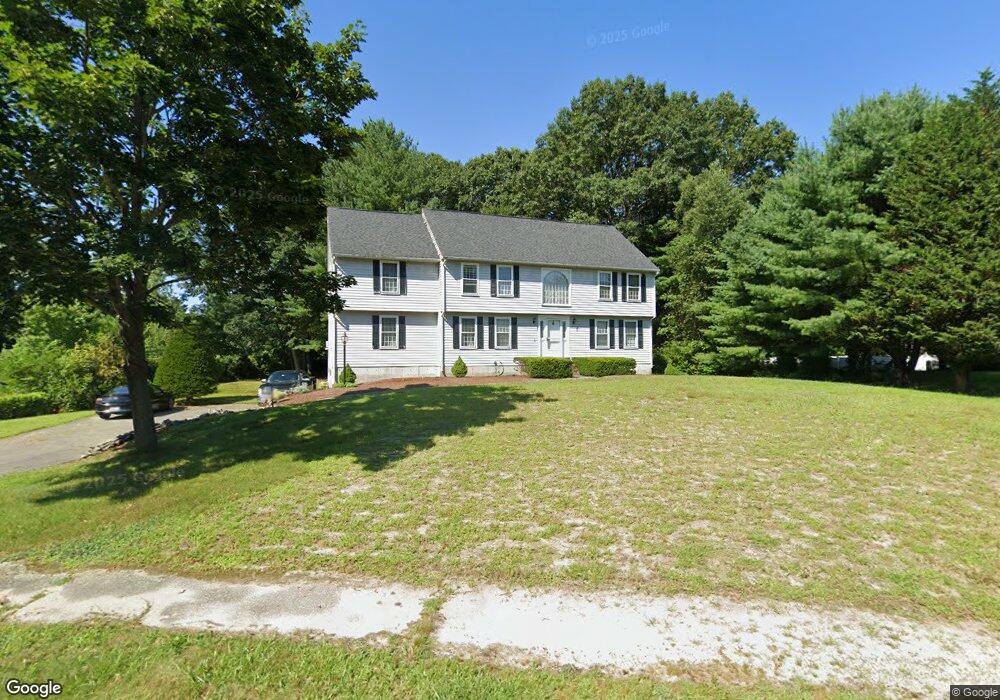
12 Palmer Way Wilmington, MA 01887
North Wilmington NeighborhoodEstimated Value: $933,000 - $1,101,000
4
Beds
3
Baths
2,960
Sq Ft
$343/Sq Ft
Est. Value
About This Home
This home is located at 12 Palmer Way, Wilmington, MA 01887 and is currently estimated at $1,016,461, approximately $343 per square foot. 12 Palmer Way is a home located in Middlesex County with nearby schools including Wilmington Middle School, Wilmington High School, and Austin Preparatory School.
Ownership History
Date
Name
Owned For
Owner Type
Purchase Details
Closed on
Dec 9, 2014
Sold by
Angus Cheryl A
Bought by
Cheryl Angus Irt
Current Estimated Value
Purchase Details
Closed on
Mar 5, 2003
Sold by
Angus John K
Bought by
Angus John
Purchase Details
Closed on
Oct 31, 1984
Bought by
Angus Laura A and Angus Brian G
Create a Home Valuation Report for This Property
The Home Valuation Report is an in-depth analysis detailing your home's value as well as a comparison with similar homes in the area
Home Values in the Area
Average Home Value in this Area
Purchase History
| Date | Buyer | Sale Price | Title Company |
|---|---|---|---|
| Cheryl Angus Irt | -- | -- | |
| Angus John | -- | -- | |
| Angus Laura A | $175,400 | -- |
Source: Public Records
Mortgage History
| Date | Status | Borrower | Loan Amount |
|---|---|---|---|
| Previous Owner | Angus Laura A | $30,000 | |
| Previous Owner | Angus Laura A | $20,000 |
Source: Public Records
Tax History Compared to Growth
Tax History
| Year | Tax Paid | Tax Assessment Tax Assessment Total Assessment is a certain percentage of the fair market value that is determined by local assessors to be the total taxable value of land and additions on the property. | Land | Improvement |
|---|---|---|---|---|
| 2025 | $11,021 | $962,500 | $356,600 | $605,900 |
| 2024 | $10,959 | $958,800 | $356,600 | $602,200 |
| 2023 | $9,977 | $835,600 | $303,500 | $532,100 |
| 2022 | $9,418 | $722,800 | $252,800 | $470,000 |
| 2021 | $9,457 | $683,300 | $229,800 | $453,500 |
| 2020 | $9,237 | $680,200 | $229,800 | $450,400 |
| 2019 | $9,138 | $664,600 | $224,400 | $440,200 |
| 2018 | $9,005 | $624,900 | $213,800 | $411,100 |
| 2017 | $9,174 | $634,900 | $222,700 | $412,200 |
| 2016 | $8,538 | $583,600 | $212,200 | $371,400 |
| 2015 | $8,207 | $571,100 | $212,200 | $358,900 |
| 2014 | $7,691 | $540,100 | $202,200 | $337,900 |
Source: Public Records
Map
Nearby Homes