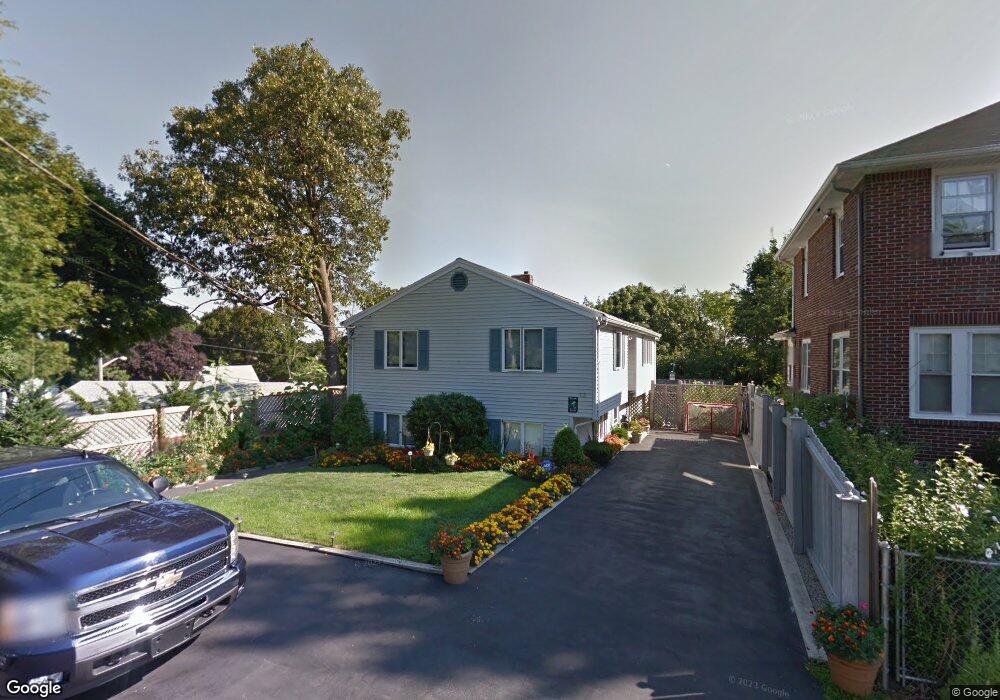
12 Patrick Rd Quincy, MA 02169
South Quincy NeighborhoodEstimated Value: $607,000 - $742,000
3
Beds
2
Baths
1,372
Sq Ft
$501/Sq Ft
Est. Value
About This Home
This home is located at 12 Patrick Rd, Quincy, MA 02169 and is currently estimated at $687,428, approximately $501 per square foot. 12 Patrick Rd is a home located in Norfolk County with nearby schools including Charles A. Bernazzani Elementary School, Central Middle School, and Quincy High School.
Ownership History
Date
Name
Owned For
Owner Type
Purchase Details
Closed on
Apr 29, 1998
Sold by
Hayes Robert P
Bought by
Hayward Timothy A and Hayward Doreen A
Current Estimated Value
Home Financials for this Owner
Home Financials are based on the most recent Mortgage that was taken out on this home.
Original Mortgage
$125,000
Interest Rate
7.04%
Mortgage Type
Purchase Money Mortgage
Create a Home Valuation Report for This Property
The Home Valuation Report is an in-depth analysis detailing your home's value as well as a comparison with similar homes in the area
Home Values in the Area
Average Home Value in this Area
Purchase History
| Date | Buyer | Sale Price | Title Company |
|---|---|---|---|
| Hayward Timothy A | $140,000 | -- |
Source: Public Records
Mortgage History
| Date | Status | Borrower | Loan Amount |
|---|---|---|---|
| Open | Hayward Timothy A | $170,000 | |
| Closed | Hayward Timothy A | $125,000 | |
| Previous Owner | Hayward Timothy A | $54,000 |
Source: Public Records
Tax History
| Year | Tax Paid | Tax Assessment Tax Assessment Total Assessment is a certain percentage of the fair market value that is determined by local assessors to be the total taxable value of land and additions on the property. | Land | Improvement |
|---|---|---|---|---|
| 2025 | $7,567 | $656,300 | $271,900 | $384,400 |
| 2024 | $7,137 | $633,300 | $258,900 | $374,400 |
| 2023 | $6,561 | $589,500 | $246,600 | $342,900 |
| 2022 | $6,317 | $527,300 | $197,300 | $330,000 |
| 2021 | $6,030 | $496,700 | $197,300 | $299,400 |
| 2020 | $5,811 | $467,500 | $197,300 | $270,200 |
| 2019 | $5,537 | $441,200 | $191,500 | $249,700 |
| 2018 | $5,628 | $421,900 | $177,300 | $244,600 |
| 2017 | $5,329 | $376,100 | $168,900 | $207,200 |
| 2016 | $4,826 | $336,100 | $153,500 | $182,600 |
| 2015 | $4,656 | $318,900 | $144,800 | $174,100 |
| 2014 | $4,571 | $307,600 | $144,800 | $162,800 |
Source: Public Records
Map
Nearby Homes
- 114 Willard St Unit 4
- 230 Willard St Unit 102
- 21 Robertson St
- 41 Wallace Rd
- 84 Gardiner Rd
- 149 Reservoir Rd
- 440 Granite Ave Unit 201
- 39 Cross St
- 40 Cross St Unit 1
- 211 Copeland St
- 17 Albany St
- 0 Franklin St
- 281 Elmwood Ave
- 1 Cityview Ln Unit 707
- 30 Elmwood Park
- 510 Willard St
- 1185 Brook Rd
- 12 Nelson St
- 46 Century Ln
- 211 West St Unit 11B
- 16 Patrick Rd
- 554 Quarry St
- 20 Patrick Rd Unit 2
- 20 Patrick Rd Unit 1
- 20 Patrick Rd
- 71 Rogers St
- 10 County Rd
- 77 Rogers St
- 555 Quarry St
- 61 Rogers St Unit 1
- 61 Rogers St
- 20 County Rd
- 5 County Rd
- 64 Rogers St
- 64 Rogers St Unit 1
- 64 Rogers St Unit 2
- 557 Quarry St
- 11 County Rd
- 81 Rogers St
- 57 Rogers St
Your Personal Tour Guide
Ask me questions while you tour the home.