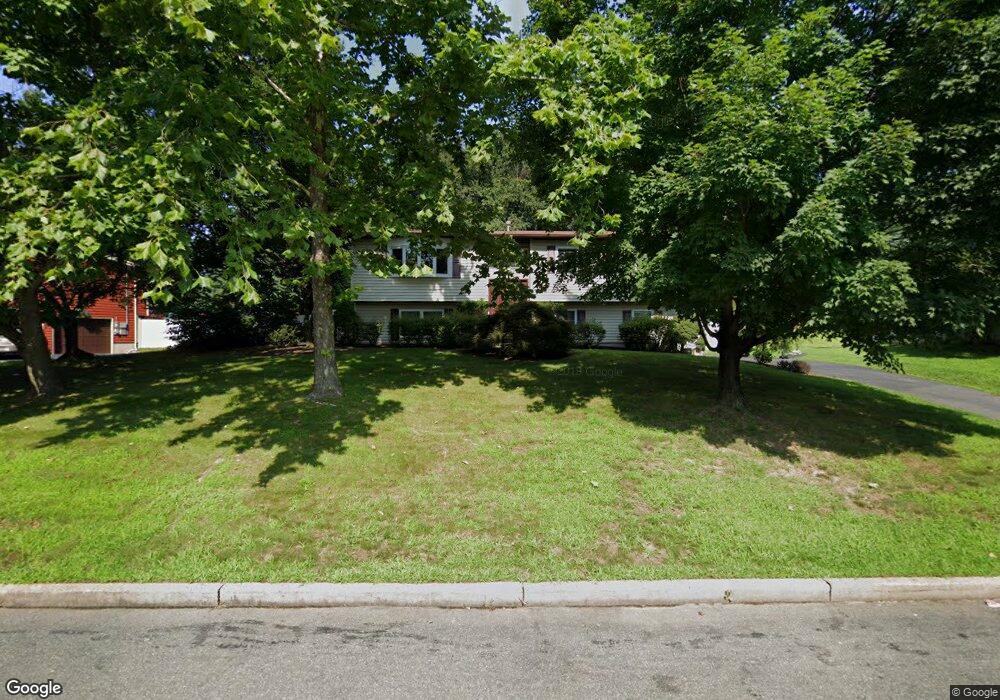
12 Peach St Nanuet, NY 10954
Estimated Value: $787,000 - $871,000
4
Beds
3
Baths
1,438
Sq Ft
$578/Sq Ft
Est. Value
About This Home
This home is located at 12 Peach St, Nanuet, NY 10954 and is currently estimated at $831,590, approximately $578 per square foot. 12 Peach St is a home located in Rockland County with nearby schools including Pearl River High School and St Anthony School.
Ownership History
Date
Name
Owned For
Owner Type
Purchase Details
Closed on
Sep 25, 2000
Sold by
Fjermestad Jerry L and Fjermestad Virginia C
Bought by
Foiles Raymond and Foiles Agena
Current Estimated Value
Home Financials for this Owner
Home Financials are based on the most recent Mortgage that was taken out on this home.
Original Mortgage
$235,000
Outstanding Balance
$86,192
Interest Rate
8%
Estimated Equity
$745,398
Purchase Details
Closed on
May 26, 2000
Sold by
Blecher Jesse and Blecher Ellen
Bought by
Blecher Ellen
Create a Home Valuation Report for This Property
The Home Valuation Report is an in-depth analysis detailing your home's value as well as a comparison with similar homes in the area
Home Values in the Area
Average Home Value in this Area
Purchase History
| Date | Buyer | Sale Price | Title Company |
|---|---|---|---|
| Foiles Raymond | $335,000 | -- | |
| Blecher Ellen | -- | -- |
Source: Public Records
Mortgage History
| Date | Status | Borrower | Loan Amount |
|---|---|---|---|
| Open | Foiles Raymond | $235,000 |
Source: Public Records
Tax History Compared to Growth
Tax History
| Year | Tax Paid | Tax Assessment Tax Assessment Total Assessment is a certain percentage of the fair market value that is determined by local assessors to be the total taxable value of land and additions on the property. | Land | Improvement |
|---|---|---|---|---|
| 2024 | $17,478 | $222,400 | $87,600 | $134,800 |
| 2023 | $17,478 | $222,400 | $87,600 | $134,800 |
| 2022 | $5,461 | $222,400 | $87,600 | $134,800 |
| 2021 | $14,895 | $222,400 | $87,600 | $134,800 |
| 2020 | $14,254 | $222,400 | $87,600 | $134,800 |
| 2019 | $5,094 | $222,400 | $87,600 | $134,800 |
| 2018 | $13,536 | $222,400 | $87,600 | $134,800 |
| 2017 | $13,076 | $222,400 | $87,600 | $134,800 |
| 2016 | $12,664 | $222,400 | $87,600 | $134,800 |
| 2015 | -- | $222,400 | $87,600 | $134,800 |
| 2014 | -- | $222,400 | $87,600 | $134,800 |
Source: Public Records
Map
Nearby Homes