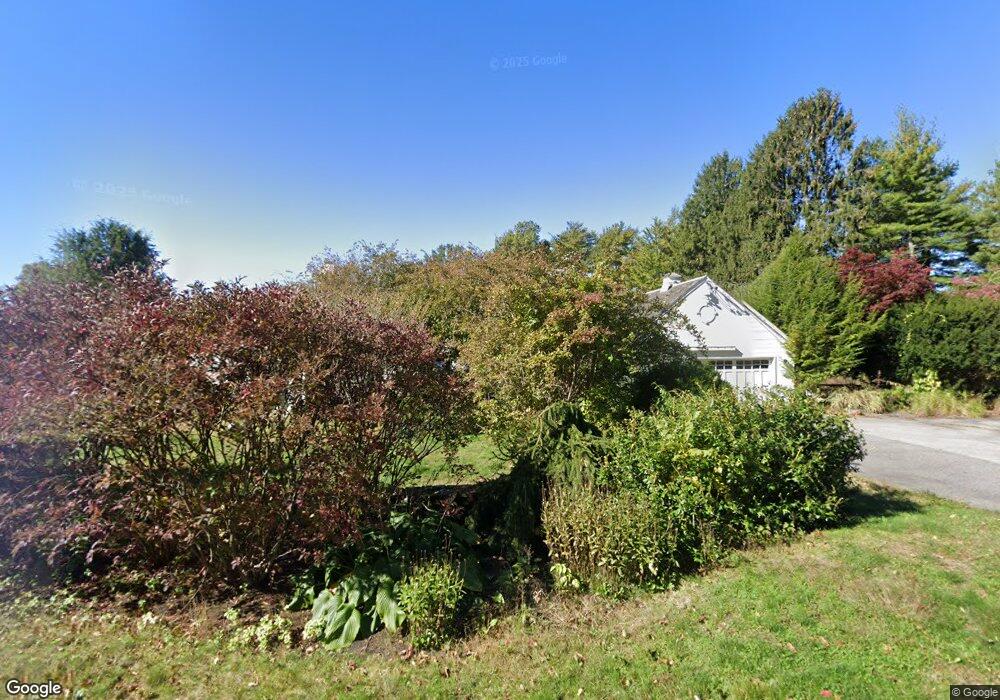
12 Peckham St Rehoboth, MA 02769
Estimated Value: $670,944 - $807,000
2
Beds
2
Baths
2,304
Sq Ft
$316/Sq Ft
Est. Value
About This Home
This home is located at 12 Peckham St, Rehoboth, MA 02769 and is currently estimated at $726,986, approximately $315 per square foot. 12 Peckham St is a home located in Bristol County with nearby schools including Dighton-Rehoboth Regional High School.
Ownership History
Date
Name
Owned For
Owner Type
Purchase Details
Closed on
Sep 3, 2025
Sold by
Housely Ederina B and Rocket Mortgage Llc
Bought by
Ri Property Wire Llc
Current Estimated Value
Purchase Details
Closed on
Dec 7, 2001
Sold by
Perry Frank
Bought by
Housley Joseph D and Housley Ederina B
Home Financials for this Owner
Home Financials are based on the most recent Mortgage that was taken out on this home.
Original Mortgage
$255,000
Interest Rate
6.67%
Mortgage Type
Purchase Money Mortgage
Create a Home Valuation Report for This Property
The Home Valuation Report is an in-depth analysis detailing your home's value as well as a comparison with similar homes in the area
Home Values in the Area
Average Home Value in this Area
Purchase History
| Date | Buyer | Sale Price | Title Company |
|---|---|---|---|
| Ri Property Wire Llc | $402,000 | -- | |
| Housley Joseph D | $319,000 | -- |
Source: Public Records
Mortgage History
| Date | Status | Borrower | Loan Amount |
|---|---|---|---|
| Previous Owner | Housley Joseph D | $255,000 | |
| Previous Owner | Housley Joseph D | $425,000 |
Source: Public Records
Tax History Compared to Growth
Tax History
| Year | Tax Paid | Tax Assessment Tax Assessment Total Assessment is a certain percentage of the fair market value that is determined by local assessors to be the total taxable value of land and additions on the property. | Land | Improvement |
|---|---|---|---|---|
| 2025 | $6,204 | $556,400 | $204,600 | $351,800 |
| 2024 | $6,471 | $569,600 | $239,200 | $330,400 |
| 2023 | $6,371 | $550,200 | $234,800 | $315,400 |
| 2022 | $6,154 | $485,700 | $217,900 | $267,800 |
| 2021 | $5,896 | $445,300 | $201,300 | $244,000 |
| 2020 | $5,728 | $436,600 | $209,300 | $227,300 |
| 2018 | $1,345 | $432,600 | $200,800 | $231,800 |
| 2017 | $4,870 | $387,700 | $200,800 | $186,900 |
| 2016 | $4,695 | $386,400 | $208,400 | $178,000 |
| 2015 | $4,323 | $351,200 | $200,200 | $151,000 |
| 2014 | $4,182 | $336,200 | $191,900 | $144,300 |
Source: Public Records
Map
Nearby Homes
- 32 Providence St
- 198 Brook St
- 205 Providence St Bldr Lot 3
- 203 Providence St Bldr Lot 5
- 0 Winter St
- 127 Mason St
- 67 Wheeler St
- 267 Chestnut St
- 17 Sassafras Rd
- 36 Columbine Rd
- 42 Linden Ln
- 8 Linden Ln
- 8 Linden Ln
- 20 School St
- 111 Summer St
- 92 Martin St
- 206 Moulton St
- 1 Cedarbrook Unit A
- 120 Plain St
- 75 Martin St