
Seller's Agent in 2025
Kathryn Baxter
Callaway Henderson Sotheby's Int'l-Princeton
(516) 521-7771
49 in this area
143 Total Sales
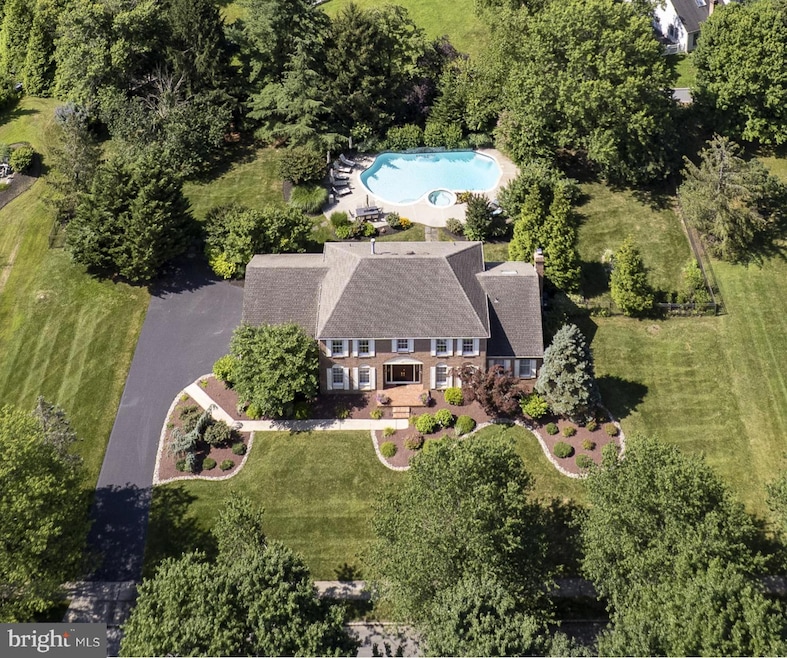
Tucked away on a peaceful interior cul-de-sac in sought-after Windsor Hunt, this
stunning Northeast-facing colonial is a true standout--- offering luxury, space, and
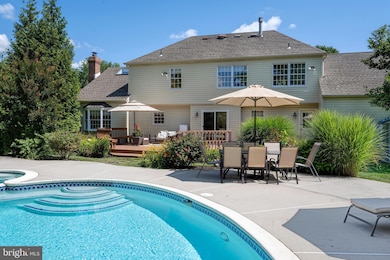
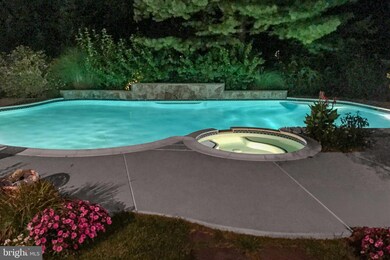
resort-style living. At the heart of the beautifully landscaped backyard lies an incredible
Gunite heated pool with a hot tub and cascading waterfall, all surrounded by a lush,
mature plantings for ultimate privacy and visual appeal. A tiered deck and fully fenced
lawn extend the outdoor entertaining space, making gatherings a breeze.
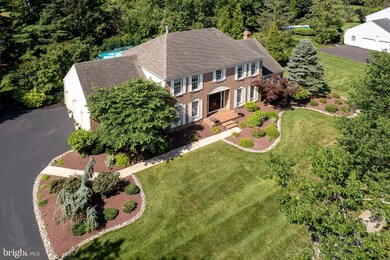
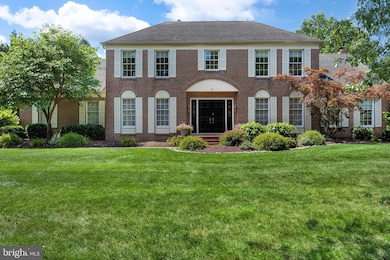
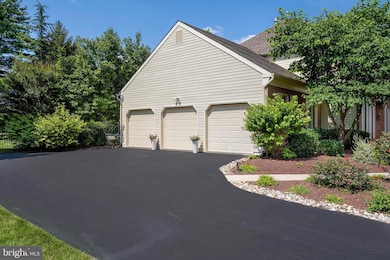
The home’s freshly painted interior and exterior create a crisp, welcoming first
impression, complimented by a refinished driveway that leads to an immaculate three-car
garage, setting the tone for what is inside. Step inside to find a gleaming maple hardwood flooring that flows from the sunlit foyer through the formal living and dining rooms, the kitchen, and the mudroom ---
adding warmth and cohesion to the first level. The study and spacious family room, has cozy, recently installed carpeting that surrounds a fireplace framed by custom built-ins --- perfect for casual nights in.
The eat-in kitchen offers newer appliances, including a sleek range and refrigerator and
connects to a laundry room with smart washer and dryer. Those working from home will love the flexibility of a dedicated study and an additional private work space tucked within the expansive primary suite. This serene primary bedroom features updated plush carpeting, a generous walk-in closet, and a luxurious
bathroom washed in sunshine, complete with dual vanity and a deep soaking tub for
relaxation. The suite is a true retreat. Three additional bedrooms share a stylish hall bath, adorned with chic tile work, offering comfort and style for family and guests alike. Downstairs, you will find a specious rec room---ideal for a playroom, gym or media lounge with loads of extra storage space.
Other highlights include newer two-zone heating and cooling, and a long list of
thoughtful upgrades throughout. Located in the top-rated West Windsor-Plainsboro school district, this move-in ready gem is just 10-minutes from Princeton Junction station for easy NJ Transit service to
NYC and Philadelphia with quick access to major highways. Don’t miss your chance, to own this exceptional home in one of West Windsor’s most sought-after neighborhoods!
Last Agent to Sell the Property
(516) 521-7771 kbaxter@callawayhenderson.com Callaway Henderson Sotheby's Int'l-Princeton License #446951 Listed on: 07/31/2025
Last Buyer's Agent
(609) 977-1663 anjalilaroia@gmail.com Keller Williams Real Estate - Princeton License #1435426
| Date | Type | Sale Price | Title Company |
|---|---|---|---|
| Deed | -- | None Available | |
| Deed | $405,000 | -- | |
| Quit Claim Deed | -- | -- | |
| Deed | $394,700 | -- |
| Date | Status | Loan Amount | Loan Type |
|---|---|---|---|
| Open | $938,250 | Reverse Mortgage Home Equity Conversion Mortgage | |
| Previous Owner | $192,000 | No Value Available |
| Date | Event | Price | List to Sale | Price per Sq Ft |
|---|---|---|---|---|
| 11/10/2025 11/10/25 | Sold | $1,509,000 | -0.6% | -- |
| 08/14/2025 08/14/25 | Pending | -- | -- | -- |
| 07/31/2025 07/31/25 | For Sale | $1,518,000 | -- | -- |
| Year | Tax Paid | Tax Assessment Tax Assessment Total Assessment is a certain percentage of the fair market value that is determined by local assessors to be the total taxable value of land and additions on the property. | Land | Improvement |
|---|---|---|---|---|
| 2025 | $21,737 | $709,200 | $297,500 | $411,700 |
| 2024 | $20,829 | $709,200 | $297,500 | $411,700 |
| 2023 | $20,829 | $709,200 | $297,500 | $411,700 |
| 2022 | $20,425 | $709,200 | $297,500 | $411,700 |
| 2021 | $20,255 | $709,200 | $297,500 | $411,700 |
| 2020 | $19,886 | $709,200 | $297,500 | $411,700 |
| 2019 | $19,659 | $709,200 | $297,500 | $411,700 |
| 2018 | $19,475 | $709,200 | $297,500 | $411,700 |
| 2017 | $19,070 | $709,200 | $297,500 | $411,700 |
| 2016 | $18,659 | $709,200 | $297,500 | $411,700 |
| 2015 | $18,226 | $709,200 | $297,500 | $411,700 |
| 2014 | $18,014 | $709,200 | $297,500 | $411,700 |
Seller's Agent in 2025
Kathryn Baxter
Callaway Henderson Sotheby's Int'l-Princeton
(516) 521-7771
49 in this area
143 Total Sales
Buyer's Agent in 2025
ANJALI LAROIA
Keller Williams Real Estate - Princeton
(609) 977-1663
8 in this area
13 Total Sales
Source: Bright MLS
MLS Number: NJME2062862
APN: 13-00024-0000-00112
Disclaimer: Certain information contained herein is derived from information provided by parties other than Homes.com. All information provided is deemed reliable, but is not guaranteed to be accurate and should be independently verified.
![]() The data relating to real estate for sale on this website appears in part through the BRIGHT Internet Data Exchange program, a voluntary cooperative exchange of property listing data between licensed real estate brokerage firms, and is provided by BRIGHT through a licensing agreement.
The data relating to real estate for sale on this website appears in part through the BRIGHT Internet Data Exchange program, a voluntary cooperative exchange of property listing data between licensed real estate brokerage firms, and is provided by BRIGHT through a licensing agreement.
Listing information is from various brokers who participate in the Bright MLS IDX program and not all listings may be visible on the site.
The property information being provided on or through the website is for the personal, non-commercial use of consumers and such information may not be used for any purpose other than to identify prospective properties consumers may be interested in purchasing.
Some properties which appear for sale on the website may no longer be available because they are for instance, under contract, sold or are no longer being offered for sale.
Property information displayed is deemed reliable but is not guaranteed.
Copyright 2025 Bright MLS, Inc.