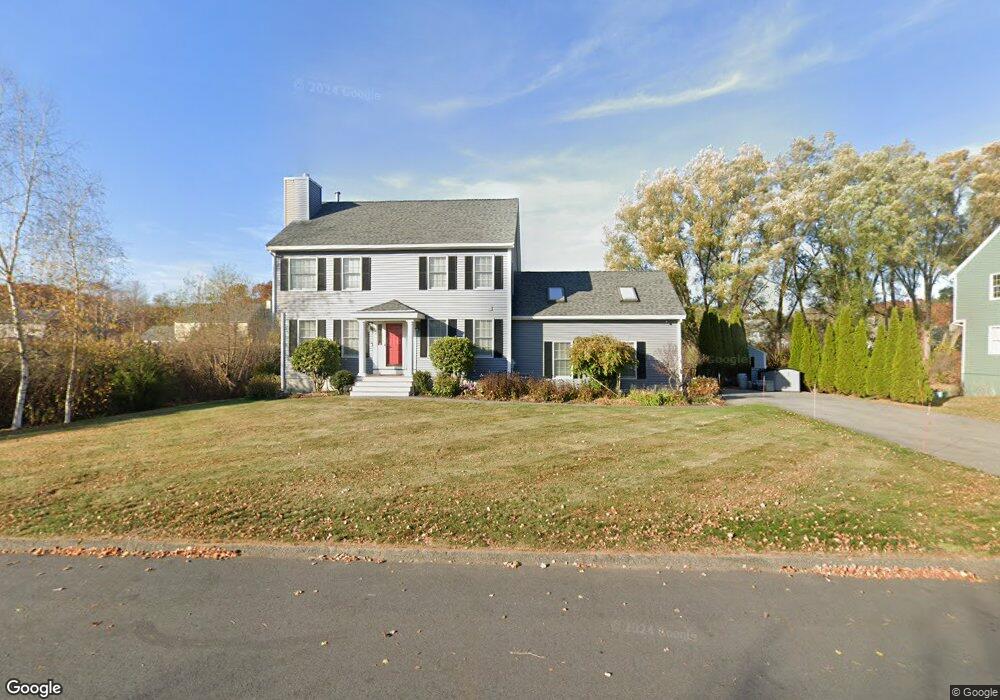
12 Pheasant Run Dr Newburyport, MA 01950
Estimated Value: $1,052,000 - $1,267,072
4
Beds
3
Baths
2,900
Sq Ft
$403/Sq Ft
Est. Value
About This Home
This home is located at 12 Pheasant Run Dr, Newburyport, MA 01950 and is currently estimated at $1,168,518, approximately $402 per square foot. 12 Pheasant Run Dr is a home located in Essex County with nearby schools including Francis T. Bresnahan Elementary School, Edward G. Molin Elementary School, and Rupert A. Nock Middle School.
Ownership History
Date
Name
Owned For
Owner Type
Purchase Details
Closed on
Aug 22, 2024
Sold by
Spellman John P and Spellman Tina S
Bought by
Spellman Ft and Spellman
Current Estimated Value
Purchase Details
Closed on
Aug 4, 2010
Sold by
Bellini Nicholas G and Bellini Kathleen M
Bought by
Spellman John P and Spellman Tina S
Purchase Details
Closed on
Jul 29, 1992
Sold by
Wildwood Nt
Bought by
Bellini Nicholas G and Bellini Kathleen M
Create a Home Valuation Report for This Property
The Home Valuation Report is an in-depth analysis detailing your home's value as well as a comparison with similar homes in the area
Home Values in the Area
Average Home Value in this Area
Purchase History
| Date | Buyer | Sale Price | Title Company |
|---|---|---|---|
| Spellman Ft | -- | None Available | |
| Spellman Ft | -- | None Available | |
| Spellman John P | $499,900 | -- | |
| Bellini Nicholas G | $165,000 | -- | |
| Spellman John P | $499,900 | -- | |
| Bellini Nicholas G | $165,000 | -- |
Source: Public Records
Mortgage History
| Date | Status | Borrower | Loan Amount |
|---|---|---|---|
| Previous Owner | Bellini Nicholas G | $296,000 | |
| Previous Owner | Bellini Nicholas G | $313,000 |
Source: Public Records
Tax History Compared to Growth
Tax History
| Year | Tax Paid | Tax Assessment Tax Assessment Total Assessment is a certain percentage of the fair market value that is determined by local assessors to be the total taxable value of land and additions on the property. | Land | Improvement |
|---|---|---|---|---|
| 2025 | $9,787 | $1,021,600 | $478,200 | $543,400 |
| 2024 | $9,608 | $963,700 | $434,700 | $529,000 |
| 2023 | $8,697 | $809,800 | $378,100 | $431,700 |
| 2022 | $8,579 | $714,300 | $315,000 | $399,300 |
| 2021 | $8,385 | $663,400 | $286,500 | $376,900 |
| 2020 | $8,404 | $654,500 | $286,500 | $368,000 |
| 2019 | $8,561 | $654,500 | $286,500 | $368,000 |
| 2018 | $8,127 | $612,900 | $273,000 | $339,900 |
| 2017 | $8,147 | $605,700 | $260,100 | $345,600 |
| 2016 | $7,611 | $568,400 | $236,900 | $331,500 |
| 2015 | $7,582 | $568,400 | $236,900 | $331,500 |
Source: Public Records
Map
Nearby Homes
- 138 Low St
- 110 Low St
- 42 Myrtle Ave
- 17 Alberta Ave
- 287 1/2 High St
- 14 Dexter Ln Unit B
- 14 Dexter Ln Unit A
- 232 Low St Unit 7
- 13 Broad St
- 27 Warren St Unit 1
- 6 Storey Ave
- 217 Merrimac St Unit 1
- 45 Boardman St Unit 1
- 7 Frances Dr
- 288 Merrimac St
- 41 Washington St Unit B
- 44 Washington St Unit C
- 266 Merrimac St Unit F
- 158 Merrimac St Unit 3
- 19 Jefferson St
- 10 Pheasant Run Dr
- 14 Pheasant Run Dr
- 15 Wildwood Dr
- 9 Pheasant Run Dr
- 7 Pheasant Run Dr
- 8 Pheasant Run Dr
- 11 Pheasant Run Dr
- 16 Pheasant Run Dr
- 9 Wildwood Dr
- 5 Pheasant Run Dr
- 17 Wildwood Dr
- 10 Wildwood Dr
- 13 Pheasant Run Dr
- 6 Pheasant Run Dr
- 10 Fox Run Dr
- 8 Wildwood Dr
- 8 Fox Run Dr
- 12 Fox Run Dr
- 7 Wildwood Dr
- 18 Pheasant Run Dr