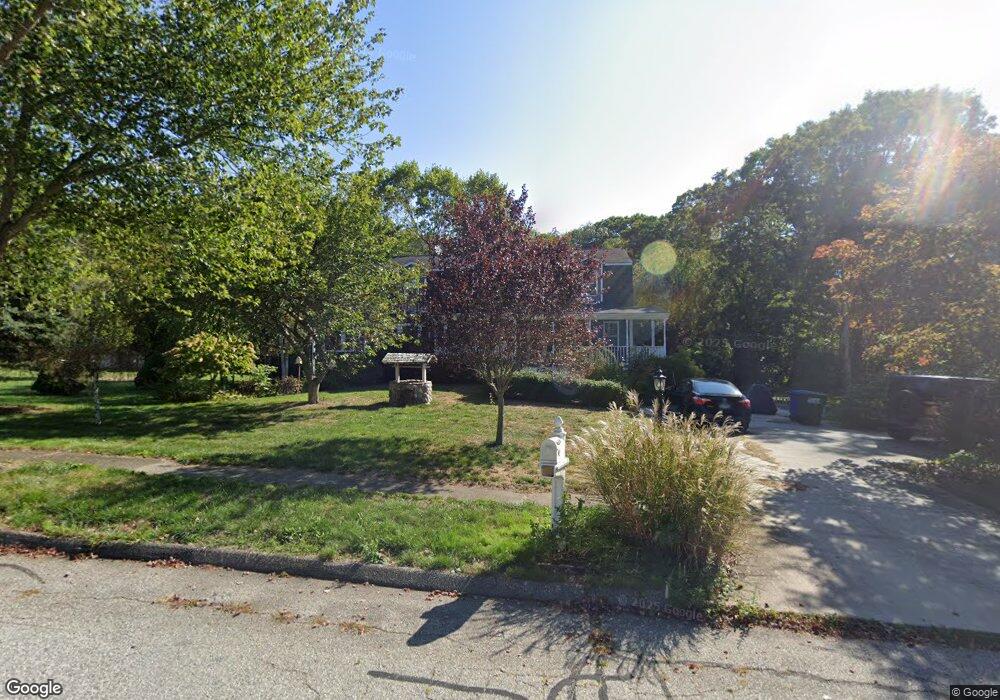
12 Pheasant Run Rd Stonington, CT 06378
Estimated Value: $695,000 - $859,000
4
Beds
3
Baths
2,992
Sq Ft
$248/Sq Ft
Est. Value
About This Home
This home is located at 12 Pheasant Run Rd, Stonington, CT 06378 and is currently estimated at $742,098, approximately $248 per square foot. 12 Pheasant Run Rd is a home located in New London County with nearby schools including Stonington Middle School, Stonington High School, and Pine Point School.
Ownership History
Date
Name
Owned For
Owner Type
Purchase Details
Closed on
Dec 4, 2023
Sold by
Turner Seth and Turner Gail
Bought by
Turner Bradley S and Tobar Kennia Z
Current Estimated Value
Home Financials for this Owner
Home Financials are based on the most recent Mortgage that was taken out on this home.
Original Mortgage
$462,000
Outstanding Balance
$452,529
Interest Rate
6.38%
Mortgage Type
Purchase Money Mortgage
Estimated Equity
$289,569
Purchase Details
Closed on
Jun 29, 2011
Sold by
Kelly-Oconnor J Est and Kelly
Bought by
Kenefick Patricia P
Purchase Details
Closed on
Feb 24, 1995
Sold by
Damato Milford Lp
Bought by
Turner Seth and Turner Gail
Create a Home Valuation Report for This Property
The Home Valuation Report is an in-depth analysis detailing your home's value as well as a comparison with similar homes in the area
Home Values in the Area
Average Home Value in this Area
Purchase History
| Date | Buyer | Sale Price | Title Company |
|---|---|---|---|
| Turner Bradley S | $577,500 | None Available | |
| Turner Bradley S | $577,500 | None Available | |
| Kenefick Patricia P | $255,000 | -- | |
| Turner Seth | $129,900 | -- | |
| Turner Seth | $129,900 | -- |
Source: Public Records
Mortgage History
| Date | Status | Borrower | Loan Amount |
|---|---|---|---|
| Open | Turner Bradley S | $462,000 | |
| Closed | Turner Bradley S | $462,000 | |
| Previous Owner | Turner Seth | $240,000 | |
| Previous Owner | Turner Seth | $65,000 |
Source: Public Records
Tax History Compared to Growth
Tax History
| Year | Tax Paid | Tax Assessment Tax Assessment Total Assessment is a certain percentage of the fair market value that is determined by local assessors to be the total taxable value of land and additions on the property. | Land | Improvement |
|---|---|---|---|---|
| 2025 | $6,831 | $330,300 | $51,900 | $278,400 |
| 2024 | $6,589 | $330,300 | $51,900 | $278,400 |
| 2023 | $6,556 | $330,300 | $51,900 | $278,400 |
| 2022 | $5,923 | $224,700 | $48,300 | $176,400 |
| 2021 | $6,011 | $224,700 | $48,300 | $176,400 |
| 2020 | $5,901 | $224,700 | $48,300 | $176,400 |
| 2019 | $5,901 | $224,700 | $48,300 | $176,400 |
| 2018 | $5,748 | $224,700 | $48,300 | $176,400 |
| 2017 | $4,971 | $191,700 | $40,200 | $151,500 |
| 2016 | $4,842 | $191,700 | $40,200 | $151,500 |
| 2015 | $4,643 | $191,700 | $40,200 | $151,500 |
| 2014 | $4,453 | $191,700 | $40,200 | $151,500 |
Source: Public Records
Map
Nearby Homes
- 50 Benjamin Stanton Pentway
- 1346 Pequot Trail
- 3 Whitehall Pond Unit 3
- 1189 Pequot Trail
- 79 Fair Acres Cir
- 40 Riverbend Dr
- 86 Fair Acres Cir
- 1198 River Rd
- 215 Pequotsepos Rd
- 10 Pleasant St
- 38 Rossie St
- 28 Rossie St
- 308 Shewville Rd
- 244 New London Turnpike
- 314 Shewville Rd
- 17 Lamphere Rd
- 16 Juniper Ln
- 174 Montauk Ave
- 116 Indigo St
- 59 Montauk Ave
- 14 Pheasant Run Rd
- 10 Pheasant Run Rd
- 25 Pheasant Run Rd
- 8 Pheasant Run Rd
- 16 Pheasant Run Rd
- 29 Pheasant Run Rd
- 37 Pheasant Run Rd
- 23 Pheasant Run Rd
- 21 Pheasant Run Rd
- 6 Pheasant Run Rd
- 39 Pheasant Run Rd
- 18 Pheasant Run Rd
- 27 Pheasant Run Rd
- 41 Pheasant Run Rd
- 17 Pheasant Run Rd
- 22 Pheasant Run Rd
- 35 Pheasant Run Rd
- 19 Pheasant Run Rd
- 11 Pheasant Run Rd
- 5 Pheasant Run Rd