
Landlord's Agent in 2023
Debra Carnesi & Jennifer DeAlmeida
Keller Williams Realty West Monmouth
(732) 996-0788
58 in this area
117 Total Sales


Estimated Value: $262,584 - $269,000
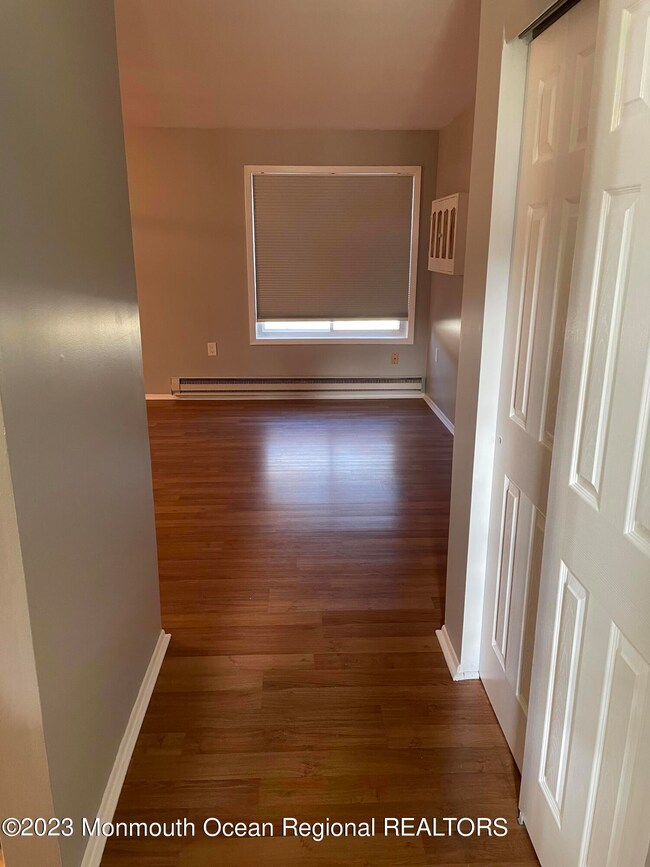
Covered Bridge 55+ Community in Manalapan premieres this lovely 1 Bed 1 Bath Condo, completely move-in-ready & waiting for you! Well maintained with plenty of upgrades throughout. This charming unit offers a spacious open Living/Dining combo with new laminate flooring in a neutral palette that is easy to customize & plenty of natural light all through. Sliders off the Dining area open to your own private Enclosed Sun Porch, perfect for relaxing after a long day.
Last Agent to Rent the Property
Debra Carnesi & Jennifer DeAlmeida
Keller Williams Realty West Monmouth License #1433692 Listed on: 02/14/2023
| Date | Buyer | Sale Price | Title Company |
|---|---|---|---|
| Loh Tian | $109,000 | First American Title | |
| Snyder Harvey | $65,000 | -- |
| Date | Status | Borrower | Loan Amount |
|---|---|---|---|
| Open | Loh Tian | $87,200 | |
| Previous Owner | Snyder Harvey | $45,500 |
| Date | Event | Price | List to Sale | Price per Sq Ft | Prior Sale |
|---|---|---|---|---|---|
| 07/01/2023 07/01/23 | Rented | $21,000 | +1100.0% | -- | |
| 06/26/2023 06/26/23 | Under Contract | -- | -- | -- | |
| 03/31/2023 03/31/23 | Price Changed | $1,750 | -2.8% | $2 / Sq Ft | |
| 02/14/2023 02/14/23 | For Rent | $1,800 | 0.0% | -- | |
| 12/29/2022 12/29/22 | Sold | $202,500 | -1.2% | $220 / Sq Ft | View Prior Sale |
| 11/22/2022 11/22/22 | For Sale | $205,000 | -- | $223 / Sq Ft |
| Year | Tax Paid | Tax Assessment Tax Assessment Total Assessment is a certain percentage of the fair market value that is determined by local assessors to be the total taxable value of land and additions on the property. | Land | Improvement |
|---|---|---|---|---|
| 2025 | $4,166 | $240,100 | $90,000 | $150,100 |
| 2024 | $3,624 | $246,800 | $115,000 | $131,800 |
| 2023 | $3,624 | $217,800 | $89,000 | $128,800 |
| 2022 | $3,176 | $201,600 | $79,000 | $122,600 |
| 2021 | $3,176 | $153,000 | $44,000 | $109,000 |
| 2020 | $3,047 | $148,400 | $40,000 | $108,400 |
| 2019 | $2,589 | $126,000 | $23,000 | $103,000 |
| 2018 | $2,505 | $121,200 | $23,000 | $98,200 |
| 2017 | $2,562 | $124,000 | $30,000 | $94,000 |
| 2016 | $2,405 | $117,800 | $25,000 | $92,800 |
| 2015 | $2,444 | $118,400 | $28,000 | $90,400 |
| 2014 | $1,863 | $87,900 | $18,000 | $69,900 |
Landlord's Agent in 2023
Debra Carnesi & Jennifer DeAlmeida
Keller Williams Realty West Monmouth
(732) 996-0788
58 in this area
117 Total Sales
J
Landlord's Co-Listing Agent in 2023
Jennifer DeAlmeida
Keller Williams Realty West Monmouth
(848) 391-9973
42 in this area
92 Total Sales
T
Tenant's Agent in 2023
Thomas O'Shea
Keller Williams Realty Monmouth/Ocean
(732) 942-5280
2 Total Sales
Seller's Agent in 2022
Linda Altieri
RE/MAX
(732) 688-1370
11 in this area
58 Total Sales
Source: MOREMLS (Monmouth Ocean Regional REALTORS®)
MLS Number: 22304024
APN: 28-00417-0000-00012-09
Disclaimer: Certain information contained herein is derived from information provided by parties other than Homes.com. All information provided is deemed reliable, but is not guaranteed to be accurate and should be independently verified.
![]() IDX information is provided exclusively for personal, non-commercial use, and may not be used for any purpose other than to identify prospective properties consumers may be interested in purchasing.
IDX information is provided exclusively for personal, non-commercial use, and may not be used for any purpose other than to identify prospective properties consumers may be interested in purchasing.
Information is deemed reliable but not guaranteed.