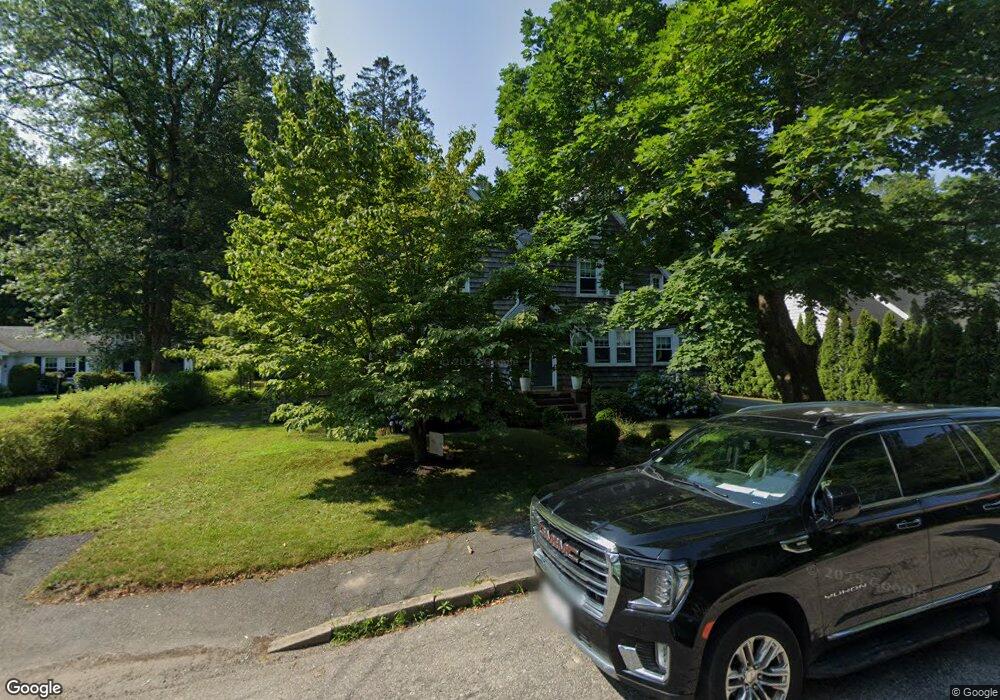
12 Pitcher St Marion, MA 02738
Marion Center NeighborhoodEstimated Value: $918,231 - $1,123,000
3
Beds
3
Baths
2,034
Sq Ft
$490/Sq Ft
Est. Value
About This Home
This home is located at 12 Pitcher St, Marion, MA 02738 and is currently estimated at $996,308, approximately $489 per square foot. 12 Pitcher St is a home located in Plymouth County with nearby schools including Old Rochester Regional High School and Tabor Academy.
Ownership History
Date
Name
Owned For
Owner Type
Purchase Details
Closed on
Apr 5, 1999
Sold by
Matoes David P
Bought by
Sewell Sheila A and Matoes Gail T
Current Estimated Value
Home Financials for this Owner
Home Financials are based on the most recent Mortgage that was taken out on this home.
Original Mortgage
$193,800
Outstanding Balance
$48,013
Interest Rate
6.78%
Mortgage Type
Purchase Money Mortgage
Estimated Equity
$948,295
Create a Home Valuation Report for This Property
The Home Valuation Report is an in-depth analysis detailing your home's value as well as a comparison with similar homes in the area
Home Values in the Area
Average Home Value in this Area
Purchase History
| Date | Buyer | Sale Price | Title Company |
|---|---|---|---|
| Sewell Sheila A | $233,800 | -- |
Source: Public Records
Mortgage History
| Date | Status | Borrower | Loan Amount |
|---|---|---|---|
| Open | Sewell Sheila A | $193,800 |
Source: Public Records
Tax History
| Year | Tax Paid | Tax Assessment Tax Assessment Total Assessment is a certain percentage of the fair market value that is determined by local assessors to be the total taxable value of land and additions on the property. | Land | Improvement |
|---|---|---|---|---|
| 2025 | $7,792 | $836,100 | $511,700 | $324,400 |
| 2024 | $6,866 | $741,500 | $467,200 | $274,300 |
| 2023 | $6,518 | $690,500 | $433,800 | $256,700 |
| 2022 | $7,522 | $693,300 | $419,200 | $274,100 |
| 2021 | $6,347 | $659,000 | $397,400 | $261,600 |
| 2020 | $4,686 | $543,800 | $317,300 | $226,500 |
| 2019 | $5,685 | $515,400 | $288,900 | $226,500 |
| 2018 | $5,491 | $479,600 | $311,900 | $167,700 |
| 2017 | $5,844 | $479,600 | $311,900 | $167,700 |
| 2016 | $5,352 | $473,200 | $311,900 | $161,300 |
| 2015 | $5,724 | $515,200 | $334,900 | $180,300 |
Source: Public Records
Map
Nearby Homes
- 16 Pitcher St Unit 2
- 16 Pitcher St
- 16 Pitcher St Unit 1
- 11 Pitcher St
- 16R Pitcher St St
- 10 Pitcher St
- 18 Pitcher St
- 102 Front St
- 102 Front St Unit 1
- 110 Front St
- 110 Front St Unit 1
- 15 Pitcher St Unit 1
- 15 Pitcher St
- 15 Pitcher St
- 19 Pitcher St
- 22 Pitcher St
- 0 Pitcher St
- 114 Front St
- 113 Front St
- 24 Pitcher St
Your Personal Tour Guide
Ask me questions while you tour the home.