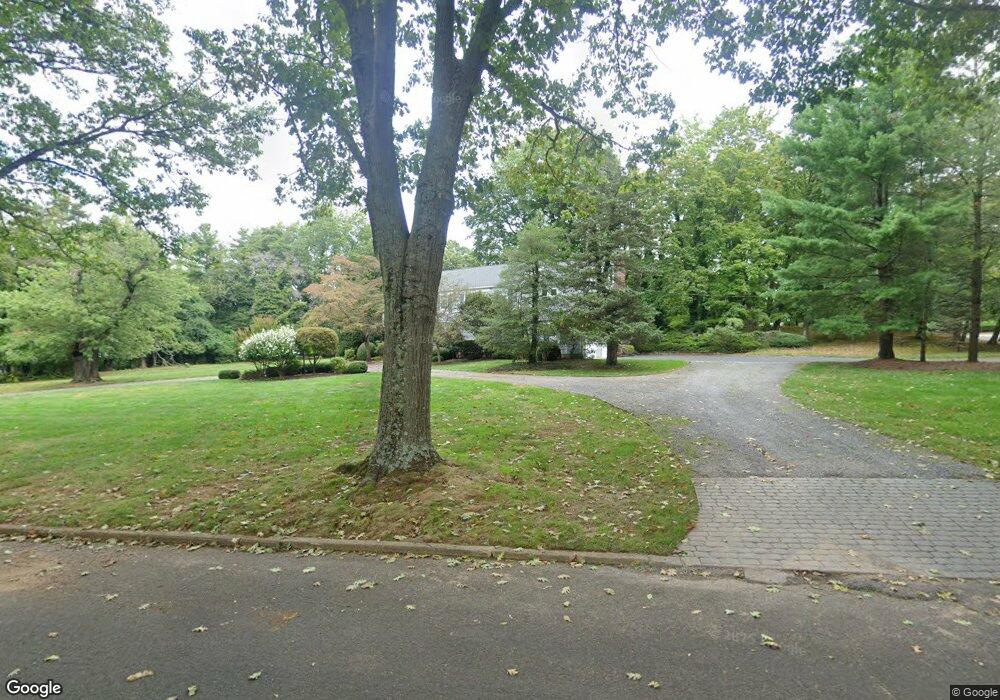
12 Popomora Dr Rumson, NJ 07760
Estimated Value: $2,696,676 - $3,523,000
5
Beds
3
Baths
3,795
Sq Ft
$802/Sq Ft
Est. Value
About This Home
This home is located at 12 Popomora Dr, Rumson, NJ 07760 and is currently estimated at $3,041,919, approximately $801 per square foot. 12 Popomora Dr is a home located in Monmouth County with nearby schools including Deane Porter School, Forrestdale School, and Rumson Fair Haven Regional High School.
Ownership History
Date
Name
Owned For
Owner Type
Purchase Details
Closed on
Sep 19, 1994
Sold by
Mcdonald Robert
Bought by
Mattina Charles and Mattina Theresa
Current Estimated Value
Home Financials for this Owner
Home Financials are based on the most recent Mortgage that was taken out on this home.
Original Mortgage
$510,000
Interest Rate
8.5%
Create a Home Valuation Report for This Property
The Home Valuation Report is an in-depth analysis detailing your home's value as well as a comparison with similar homes in the area
Home Values in the Area
Average Home Value in this Area
Purchase History
| Date | Buyer | Sale Price | Title Company |
|---|---|---|---|
| Mattina Charles | $685,000 | -- |
Source: Public Records
Mortgage History
| Date | Status | Borrower | Loan Amount |
|---|---|---|---|
| Closed | Mattina Charles | $510,000 |
Source: Public Records
Tax History Compared to Growth
Tax History
| Year | Tax Paid | Tax Assessment Tax Assessment Total Assessment is a certain percentage of the fair market value that is determined by local assessors to be the total taxable value of land and additions on the property. | Land | Improvement |
|---|---|---|---|---|
| 2025 | $24,785 | $2,384,300 | $1,773,600 | $610,700 |
| 2024 | $24,484 | $2,253,200 | $1,689,100 | $564,100 |
| 2023 | $24,484 | $2,094,400 | $1,583,000 | $511,400 |
| 2022 | $23,336 | $1,837,400 | $1,357,000 | $480,400 |
| 2021 | $23,336 | $1,639,900 | $1,218,800 | $421,100 |
| 2020 | $23,127 | $1,613,900 | $1,232,500 | $381,400 |
| 2019 | $22,501 | $1,531,700 | $982,500 | $549,200 |
| 2018 | $22,320 | $1,506,100 | $982,500 | $523,600 |
| 2017 | $21,891 | $1,490,200 | $982,500 | $507,700 |
| 2016 | $21,171 | $1,477,400 | $982,500 | $494,900 |
| 2015 | $21,141 | $1,455,000 | $982,500 | $472,500 |
| 2014 | $21,014 | $1,442,300 | $982,500 | $459,800 |
Source: Public Records
Map
Nearby Homes
- 4 Circle Dr
- 69 W River Rd
- 40 Buena Vista Ave
- 5 Oakwood Ln
- 7 Allen St
- 84 Bingham Ave
- 17 Bingham Ave
- 7 Buttonwood Dr
- 33 Lennox Ave
- 82 Church St
- 809 Navesink River Rd
- 17 Bingham Ct
- 41 Forrest Ave
- 24 Bingham Ct
- 11 Bingham Ct
- 26 Bingham Ct
- 5 Bingham Ct
- 934 Navesink River Rd
- 137 Bingham Ave
- 942 Navesink River Rd