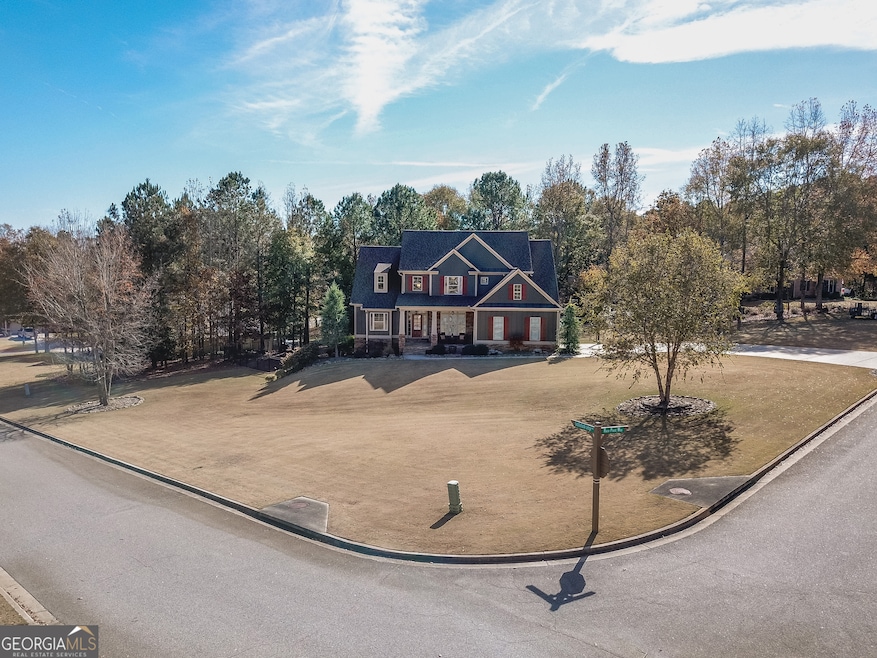
12 Race Point Way Sharpsburg, GA 30277
Estimated payment $4,207/month
Highlights
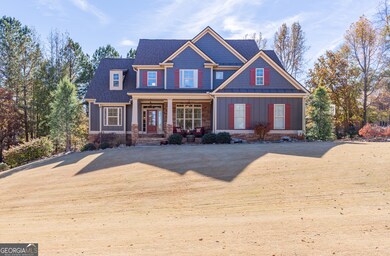
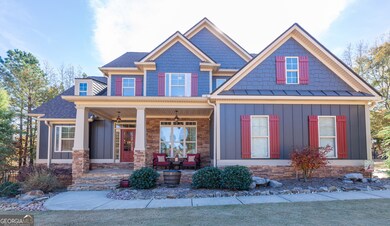
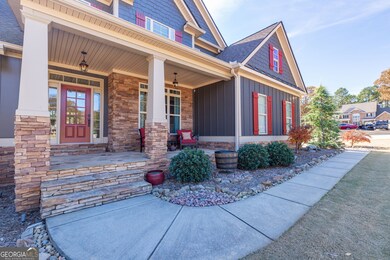
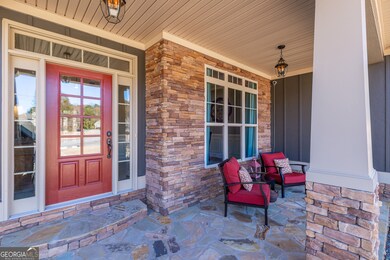
- Craftsman Architecture
- Dining Room Seats More Than Twelve
- Vaulted Ceiling
- Canongate Elementary School Rated A-
- Deck
- Wood Flooring
About This Home
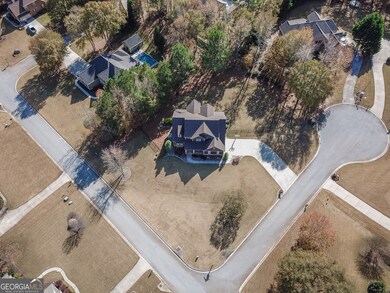
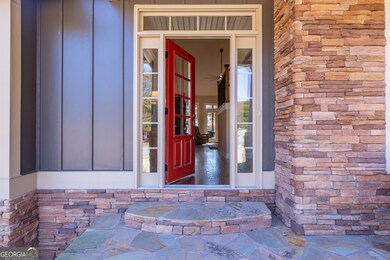
The Estates of Beaconsfield home at 12 Race Point Way in Sharpsburg is a hidden gem located within 2 miles of Canongate Elem, Blake Bass Middle, and Northgate High School. The home was built in 2008 with 2791 finished sq ft and a full, unfinished basement (1882 sq ft). The property sits on a cul-de-sac, corner lot with a wrought-iron fenced back yard, and room for a pool. There are 4 bedrooms, with the master bedroom on the main level, 3 full bathrooms along with a guest powder room. The dining room could be used as an office. The living room has high ceilings, lovely natural light from the back deck, and accessible continuance to the kitchen. The large kitchen with built-in over and microwave, and gas cooktop, has an open keeping room with gas logs fireplace. There's a walk-in pantry, laundry room, and drop zone near the 2-car garage entrance. The master bedroom has beautiful light, a sliding barn door to a walk-in closet, separate vanities, soaking tub, separate walk-in shower, and private water closet. Three additional bedrooms upstairs have a loft workspace/study area. One bedroom has a private on-suite, while the other two bedrooms share a shower and toilet but each has it's own private vanity. The basement is framed and stubbed for a bathroom and waiting for your ideas for use. A utility door allows access to the back yard where there is room to enjoy the lower patio or covered deck. There's a built-in basketball goal, or use the neighborhood amenities: pool, playground, tennis/pickle ball court, and basketball court. The neighborhood has street lights and sidewalks. Beaconsfield has several "neighborly" interactions available such as: trick-or-treating, visit from Santa, Easter egg hunt, Bunco, Pub crawl, book club, Facebook page, food trucks, etc. Logistics of the home: New roof and gutters- 2023, New exterior paint 2023, septic cleaned 2023.
Home Details
Home Type
- Single Family
Est. Annual Taxes
- $5,455
Year Built
- Built in 2008
Lot Details
- 0.75 Acre Lot
- Cul-De-Sac
- Back Yard Fenced
- Corner Lot
- Level Lot
HOA Fees
- $63 Monthly HOA Fees
Home Design
- Craftsman Architecture
- Composition Roof
- Stone Siding
- Stone
Interior Spaces
- 1.5-Story Property
- Tray Ceiling
- Vaulted Ceiling
- Ceiling Fan
- 1 Fireplace
- Two Story Entrance Foyer
- Family Room
- Dining Room Seats More Than Twelve
- Formal Dining Room
- Home Office
- Loft
- Keeping Room
- Pull Down Stairs to Attic
- Laundry Room
Kitchen
- Breakfast Area or Nook
- Breakfast Bar
- Walk-In Pantry
- Built-In Oven
- Cooktop
- Microwave
- Dishwasher
- Stainless Steel Appliances
- Solid Surface Countertops
Flooring
- Wood
- Carpet
- Tile
Bedrooms and Bathrooms
- 4 Bedrooms | 1 Primary Bedroom on Main
- Walk-In Closet
- Double Vanity
- Soaking Tub
- Bathtub Includes Tile Surround
- Separate Shower
Basement
- Basement Fills Entire Space Under The House
- Interior and Exterior Basement Entry
- Stubbed For A Bathroom
- Natural lighting in basement
Parking
- Garage
- Parking Accessed On Kitchen Level
- Garage Door Opener
Outdoor Features
- Deck
- Porch
Schools
- Cannongate Elementary School
- Blake Bass Middle School
- Northgate High School
Utilities
- Forced Air Zoned Heating and Cooling System
- Cooling System Powered By Gas
- Gas Water Heater
- Septic Tank
- High Speed Internet
- Cable TV Available
Listing and Financial Details
- Tax Lot 90
Community Details
Overview
- $750 Initiation Fee
- Association fees include ground maintenance, management fee, reserve fund, sewer, swimming, tennis
- The Estates Of Beaconsfield Subdivision
Amenities
- Laundry Facilities
Recreation
- Community Playground
- Community Pool
Map
Home Values in the Area
Average Home Value in this Area
Tax History
| Year | Tax Paid | Tax Assessment Tax Assessment Total Assessment is a certain percentage of the fair market value that is determined by local assessors to be the total taxable value of land and additions on the property. | Land | Improvement |
|---|---|---|---|---|
| 2025 | $5,603 | $245,770 | $42,000 | $203,770 |
| 2024 | $5,353 | $235,182 | $42,000 | $193,182 |
| 2023 | $5,353 | $222,460 | $30,000 | $192,460 |
| 2022 | $4,622 | $192,330 | $28,000 | $164,330 |
| 2021 | $4,347 | $169,816 | $28,000 | $141,816 |
| 2020 | $4,375 | $169,816 | $28,000 | $141,816 |
| 2019 | $4,411 | $155,494 | $22,000 | $133,494 |
| 2018 | $4,419 | $155,494 | $22,000 | $133,494 |
| 2017 | $4,231 | $149,137 | $22,000 | $127,137 |
| 2016 | $4,183 | $149,137 | $22,000 | $127,137 |
| 2015 | $3,804 | $138,240 | $22,000 | $116,240 |
| 2014 | $3,648 | $133,699 | $22,000 | $111,699 |
Property History
| Date | Event | Price | List to Sale | Price per Sq Ft |
|---|---|---|---|---|
| 11/18/2025 11/18/25 | For Sale | $700,000 | -- | $251 / Sq Ft |
Purchase History
| Date | Type | Sale Price | Title Company |
|---|---|---|---|
| Warranty Deed | $390,500 | -- | |
| Deed | $384,800 | -- | |
| Deed | $275,000 | -- | |
| Deed | $843,600 | -- | |
| Deed | -- | -- |
Mortgage History
| Date | Status | Loan Amount | Loan Type |
|---|---|---|---|
| Open | $255,500 | New Conventional | |
| Previous Owner | $234,800 | New Conventional |
Source: Georgia MLS
MLS Number: 10645726
APN: 131-6107-101
Disclaimer: Certain information contained herein is derived from information provided by parties other than Homes.com. All information provided is deemed reliable, but is not guaranteed to be accurate and should be independently verified.
![]() The data relating to real estate for sale on this web site comes in part from the Broker Reciprocity Program of Georgia MLS. Real estate listings held by brokerage firms other than Redfin are marked with the Broker Reciprocity logo and detailed information about them includes the name of the listing brokers. Information deemed reliable but not guaranteed. Copyright 2025 Georgia MLS. All rights reserved.
The data relating to real estate for sale on this web site comes in part from the Broker Reciprocity Program of Georgia MLS. Real estate listings held by brokerage firms other than Redfin are marked with the Broker Reciprocity logo and detailed information about them includes the name of the listing brokers. Information deemed reliable but not guaranteed. Copyright 2025 Georgia MLS. All rights reserved.
- 319 Beaconsfield Dr
- 125 Cannongate Cir
- 95 Tyler Woods Dr
- 131 Cannongate Cir
- 25 Sycamore Way
- 11 Line Creek Cir
- 259 Strathmore Dr Unit 3
- 75 Tomahawk Dr
- 2043 Fischer Rd
- 2039 Fischer Rd
- 121 Northwoods Rd
- 10 Fisher Way
- 40 Wenham Ln
- 68 Timbercreek Estates
- 68 Timbercreek Estates Dr
- 70 N Strathmore Dr
- 20 Skipton Ct
- 972 Raymond Hill Rd
- 0 Maple Trail
- 319 Le Paradis Blvd
- 17 Stonemount Ct
- 58 Stowe Way
- 609 Tulip Poplar Dr
- 29 Highland Park Dr
- 147 Soundview Trace
- 311 Cranford Mill Dr
- 207 Randall Dr
- 672 Andrew Bailey Rd
- 504 Cunninghame Ct
- 603 Skye Ct
- 331 Caledonia Ct
- 705 Lanarck Way
- 100 Hyacinth Ln
- 105 Pemberton Place
- 657 Senoia Rd
- 681 Senoia Rd
- 450 Bandon Way
- 1000 Newgate Rd
- 55 Pilgrim Way
- 20 Homeport Dr
