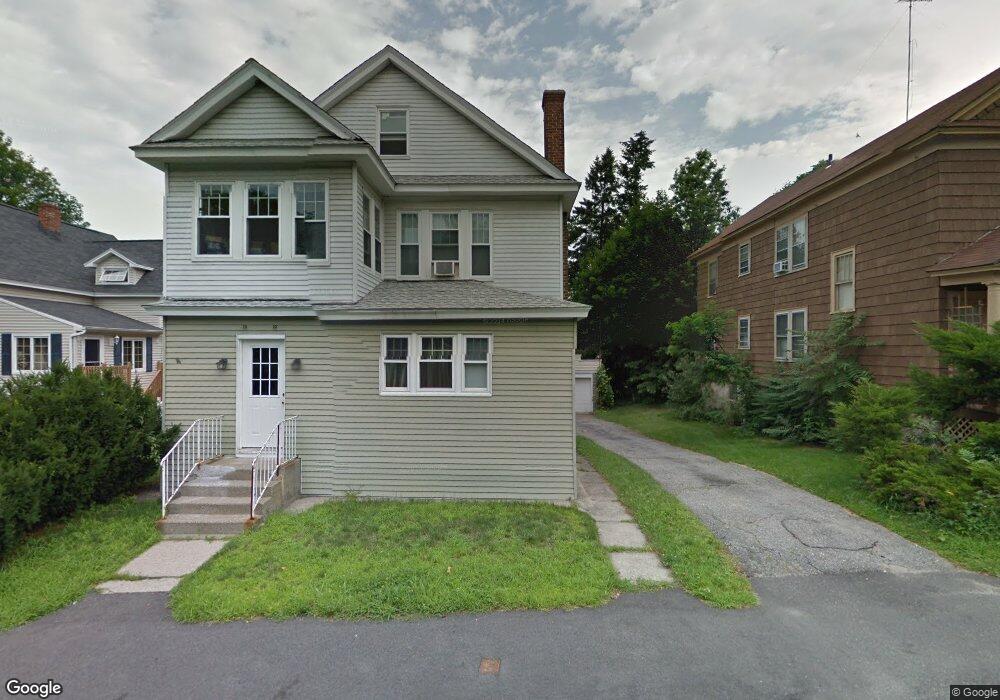
12 Rankin St Worcester, MA 01605
Brittan Square NeighborhoodEstimated Value: $524,720 - $590,000
5
Beds
2
Baths
2,434
Sq Ft
$227/Sq Ft
Est. Value
About This Home
This home is located at 12 Rankin St, Worcester, MA 01605 and is currently estimated at $552,430, approximately $226 per square foot. 12 Rankin St is a home located in Worcester County with nearby schools including Jacob Hiatt Magnet School, Chandler Magnet, and Wawecus Road School.
Ownership History
Date
Name
Owned For
Owner Type
Purchase Details
Closed on
Jul 10, 2015
Sold by
Johansson Kenneth L and Johansson Carla B
Bought by
Johansson Ft and Johansson Daniel
Current Estimated Value
Purchase Details
Closed on
Jun 28, 2013
Sold by
Johansson Carla B and Breitkreutz Virginia E
Bought by
Johnsson Carla B and Johnsson Kenneth
Home Financials for this Owner
Home Financials are based on the most recent Mortgage that was taken out on this home.
Original Mortgage
$106,500
Interest Rate
3.51%
Mortgage Type
New Conventional
Create a Home Valuation Report for This Property
The Home Valuation Report is an in-depth analysis detailing your home's value as well as a comparison with similar homes in the area
Home Values in the Area
Average Home Value in this Area
Purchase History
| Date | Buyer | Sale Price | Title Company |
|---|---|---|---|
| Johansson Ft | -- | -- | |
| Johnsson Carla B | -- | -- |
Source: Public Records
Mortgage History
| Date | Status | Borrower | Loan Amount |
|---|---|---|---|
| Previous Owner | Johnsson Carla B | $106,500 |
Source: Public Records
Tax History Compared to Growth
Tax History
| Year | Tax Paid | Tax Assessment Tax Assessment Total Assessment is a certain percentage of the fair market value that is determined by local assessors to be the total taxable value of land and additions on the property. | Land | Improvement |
|---|---|---|---|---|
| 2025 | $6,666 | $505,400 | $98,600 | $406,800 |
| 2024 | $6,344 | $461,400 | $98,600 | $362,800 |
| 2023 | $5,944 | $414,500 | $85,700 | $328,800 |
| 2022 | $5,497 | $361,400 | $68,600 | $292,800 |
| 2021 | $5,037 | $309,400 | $54,900 | $254,500 |
| 2020 | $4,614 | $271,400 | $54,500 | $216,900 |
| 2019 | $4,617 | $256,500 | $47,600 | $208,900 |
| 2018 | $4,523 | $239,200 | $47,600 | $191,600 |
| 2017 | $4,317 | $224,600 | $47,600 | $177,000 |
| 2016 | $4,291 | $208,200 | $34,000 | $174,200 |
| 2015 | $4,179 | $208,200 | $34,000 | $174,200 |
| 2014 | -- | $208,200 | $34,000 | $174,200 |
Source: Public Records
Map
Nearby Homes
- 37 Kenwood Ave
- 3 Selden St
- 2 Selden St
- 23 Ashton St
- 33 Denmark St
- 19 Mckinley Rd
- 65 Paine St
- 74 Green Hill Pkwy
- 78 Green Hill Pkwy
- 82 Green Hill Pkwy
- 176 Lincoln St Unit 4
- 26 Orne St
- 44 Westminster St
- 41 Westminster St
- 55 Channing St
- 14 Mary Ann Dr
- 63 North St Unit A
- 63 North St Unit B
- 10 Dryden St Unit 7
- 23 Dryden St
- 12 Rankin St Unit 12
- 8 Rankin St
- 18 Rankin St
- 36 Burncoat Heights
- 9 Rankin St
- 38 Burncoat St
- 24 Rankin St
- 5 Rankin St
- 42 Burncoat St
- 42 Burncoat St Unit 1
- 44 Burncoat St
- 19 Rankin St
- 15 Rankin St
- 34 Burncoat St
- 34 Burncoat St Unit 1
- 23 Rankin St
- 53 Rankin St
- 32 Burncoat St
- 32 Burncoat St Unit 3
- 32 Burncoat St Unit 2