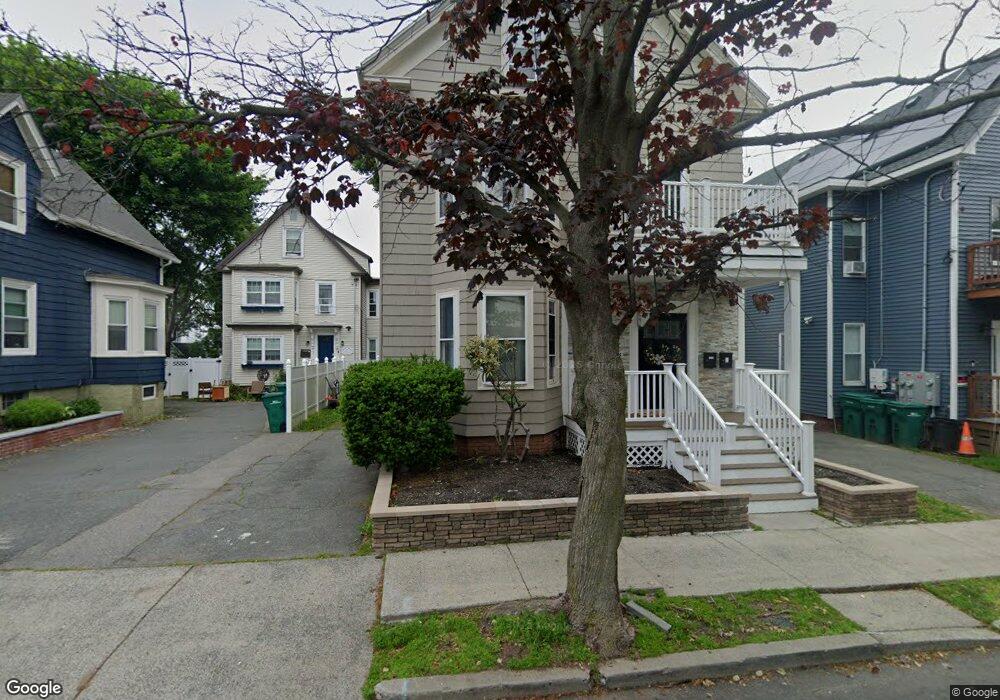
12 Red Rock St Unit 1 Lynn, MA 01902
Diamond District NeighborhoodEstimated Value: $797,000 - $929,000
2
Beds
1
Bath
700
Sq Ft
$1,223/Sq Ft
Est. Value
About This Home
This home is located at 12 Red Rock St Unit 1, Lynn, MA 01902 and is currently estimated at $855,895, approximately $1,222 per square foot. 12 Red Rock St Unit 1 is a home located in Essex County with nearby schools including Brickett Elementary School, William R. Fallon School, and Marshall Middle School.
Ownership History
Date
Name
Owned For
Owner Type
Purchase Details
Closed on
Jul 20, 2021
Sold by
Curran Neil and Grubis Suzanne M
Bought by
Vega Juan and Vega Yarit M
Current Estimated Value
Home Financials for this Owner
Home Financials are based on the most recent Mortgage that was taken out on this home.
Original Mortgage
$751,143
Outstanding Balance
$675,607
Interest Rate
2.9%
Mortgage Type
FHA
Estimated Equity
$180,288
Create a Home Valuation Report for This Property
The Home Valuation Report is an in-depth analysis detailing your home's value as well as a comparison with similar homes in the area
Home Values in the Area
Average Home Value in this Area
Purchase History
| Date | Buyer | Sale Price | Title Company |
|---|---|---|---|
| Vega Juan | $765,000 | None Available | |
| Vega Juan | $765,000 | None Available | |
| Vega Juan | $765,000 | None Available |
Source: Public Records
Mortgage History
| Date | Status | Borrower | Loan Amount |
|---|---|---|---|
| Open | Vega Juan | $751,143 | |
| Closed | Vega Juan | $751,143 |
Source: Public Records
Tax History
| Year | Tax Paid | Tax Assessment Tax Assessment Total Assessment is a certain percentage of the fair market value that is determined by local assessors to be the total taxable value of land and additions on the property. | Land | Improvement |
|---|---|---|---|---|
| 2025 | $7,912 | $763,752 | $207,500 | $556,252 |
| 2024 | $4,479 | $425,400 | $219,800 | $205,600 |
| 2023 | $7,605 | $682,100 | $203,700 | $478,400 |
| 2022 | $7,533 | $606,000 | $162,100 | $443,900 |
| 2021 | $6,550 | $502,700 | $159,200 | $343,500 |
| 2020 | $6,001 | $447,800 | $142,600 | $305,200 |
| 2019 | $5,890 | $411,900 | $138,400 | $273,500 |
| 2018 | $5,443 | $359,300 | $129,300 | $230,000 |
| 2017 | $5,296 | $339,500 | $123,100 | $216,400 |
| 2016 | $5,040 | $311,500 | $120,600 | $190,900 |
| 2015 | $4,921 | $293,800 | $124,700 | $169,100 |
Source: Public Records
Map
Nearby Homes
- 6 Nichols St
- 185 Lewis St Unit 4
- 11 Seymour Ave Unit 3
- 7 Sidney Ave
- 13 Portland St Unit 4
- 12 Howard St
- 285 Lynn Shore Dr Unit 508
- 285 Lynn Shore Dr Unit 203
- 97 Seymour Ave
- 300 Lynn Shore Dr Unit 711
- 133 Chestnut St
- 14-16 Dexter St
- 32 Kings Beach Terrace
- 95 Nahant St Unit 12
- 95 Nahant St Unit 39
- 95 Nahant St Unit 5-33
- 79 Brookline St
- 13 Nahant St Unit 2D
- 13 Nahant St Unit 3A
- 13 Nahant St Unit 4C
- 12 Red Rock St
- 16 Red Rock St
- 16 Red Rock St Unit 1
- 10 Red Rock St
- 8 Red Rock St
- 20 Red Rock St
- 13 Red Rock St
- 11 Red Rock St
- 11 Red Rock St Unit 2
- 13 Red Rock St Unit 13
- 11 Red Rock St Unit 11
- 22 Red Rock St
- 31 Bassett St
- 29 Bassett St
- 8 Garland St Unit 3
- 8 Garland St Unit 2
- 8 Garland St Unit 1
- 19 Red Rock St
- 37 Basset St Unit 1B
- 37 Basset St Unit 37-1B Utilities Incl