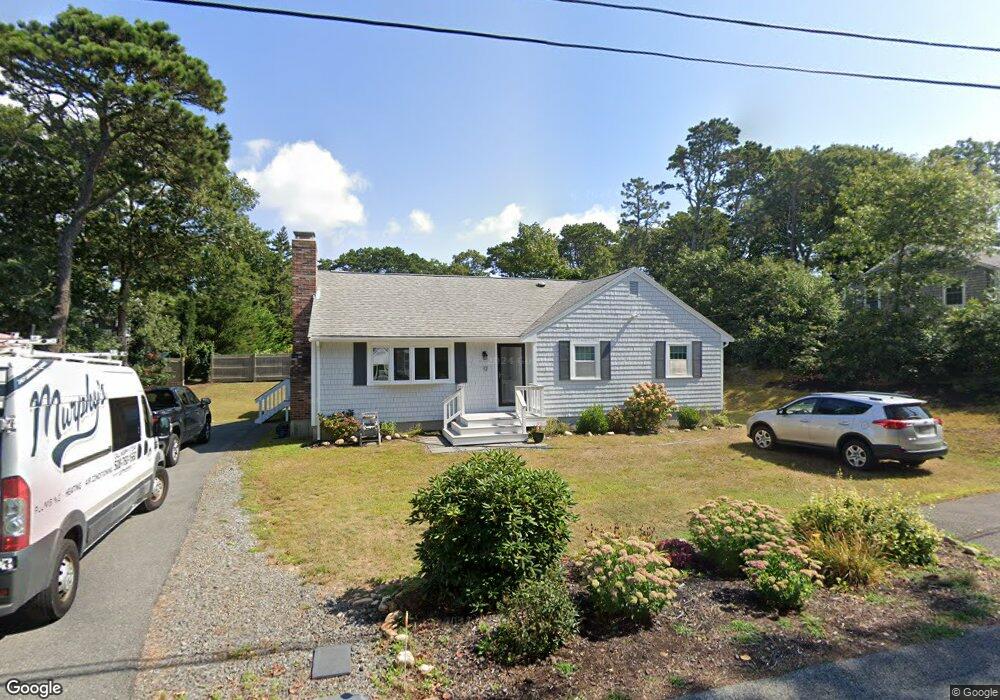
12 Restabit Rd Harwich, MA 02645
Estimated Value: $686,487 - $759,000
3
Beds
2
Baths
1,244
Sq Ft
$582/Sq Ft
Est. Value
About This Home
This home is located at 12 Restabit Rd, Harwich, MA 02645 and is currently estimated at $724,122, approximately $582 per square foot. 12 Restabit Rd is a home located in Barnstable County with nearby schools including Harwich Elementary School, Chatham Elementary School, and Monomoy Regional Middle School.
Ownership History
Date
Name
Owned For
Owner Type
Purchase Details
Closed on
Dec 5, 2023
Sold by
Keith James R and Grant Paula M
Bought by
Keit & Grant Ft and Keith
Current Estimated Value
Purchase Details
Closed on
Aug 29, 2019
Sold by
Lewis Paula K
Bought by
Keith James R and Grant Paula M
Purchase Details
Closed on
Jun 25, 2012
Sold by
Keith James R and Keith Paula M
Bought by
Keith James R and Grant Paula M
Purchase Details
Closed on
May 6, 1982
Bought by
Keith James R and Grant Paula M
Create a Home Valuation Report for This Property
The Home Valuation Report is an in-depth analysis detailing your home's value as well as a comparison with similar homes in the area
Home Values in the Area
Average Home Value in this Area
Purchase History
| Date | Buyer | Sale Price | Title Company |
|---|---|---|---|
| Keit & Grant Ft | -- | None Available | |
| Keith James R | -- | -- | |
| Keith James R | -- | -- | |
| Keith James R | -- | -- | |
| Keith James R | -- | -- |
Source: Public Records
Tax History Compared to Growth
Tax History
| Year | Tax Paid | Tax Assessment Tax Assessment Total Assessment is a certain percentage of the fair market value that is determined by local assessors to be the total taxable value of land and additions on the property. | Land | Improvement |
|---|---|---|---|---|
| 2025 | $3,677 | $622,100 | $229,500 | $392,600 |
| 2024 | $3,540 | $587,000 | $216,500 | $370,500 |
| 2023 | $3,421 | $515,200 | $196,800 | $318,400 |
| 2022 | $3,354 | $413,600 | $171,200 | $242,400 |
| 2021 | $3,303 | $384,100 | $169,200 | $214,900 |
| 2020 | $3,281 | $375,800 | $168,600 | $207,200 |
| 2019 | $3,013 | $347,500 | $159,900 | $187,600 |
| 2018 | $2,887 | $318,500 | $129,800 | $188,700 |
| 2017 | $2,663 | $296,900 | $118,300 | $178,600 |
| 2016 | $2,605 | $287,200 | $118,300 | $168,900 |
| 2015 | $2,654 | $295,900 | $129,900 | $166,000 |
| 2014 | $2,519 | $287,200 | $126,000 | $161,200 |
Source: Public Records
Map
Nearby Homes
- 90, 92, 0 John Joseph Rd
- 90, 0 John Joseph Rd
- 92 John Joseph Rd
- 63 Idle Way
- 10 Lakeside Terrace
- 1051 Orleans Rd
- 194 John Joseph Rd
- 7 Sandy Ln
- 1025 Orleans-Harwich Rd
- 26 Pleasant Park Cir
- 38 Rainbow Way
- 850 Queen Anne Rd
- 26 Turning Way
- 35 Driftwood Cir
- 310 Depot Rd
- 16 Bascom Hollow
- 35 Sterling Rd
- 26 Walkerwoods Dr
- 861 Orleans Rd