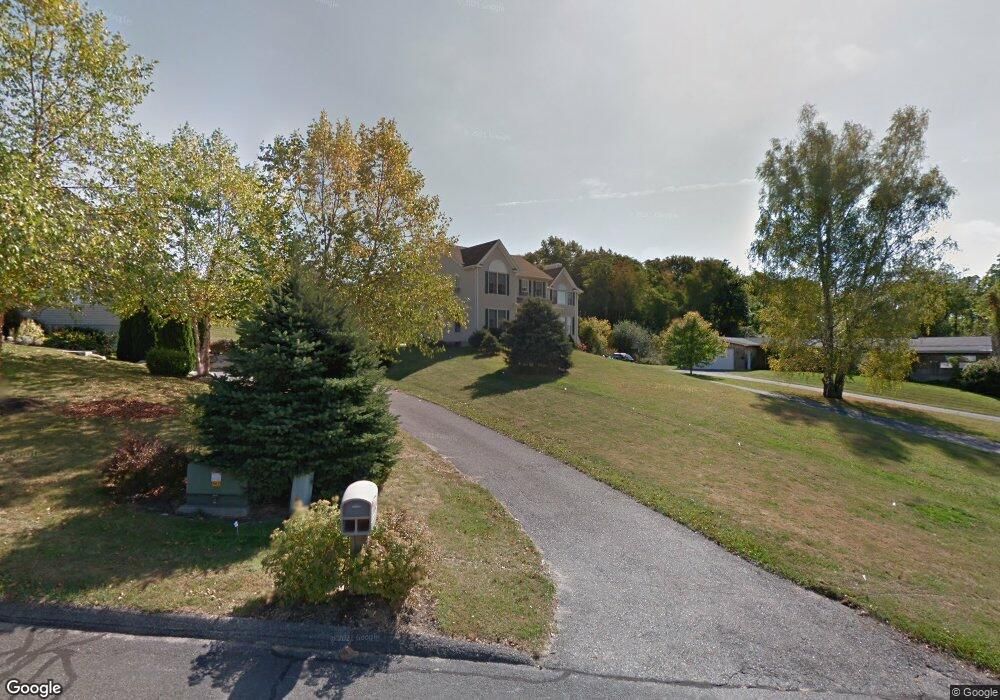
12 Reynolds Farm Ln New Milford, CT 06776
Estimated Value: $576,344 - $624,000
4
Beds
3
Baths
2,306
Sq Ft
$258/Sq Ft
Est. Value
About This Home
This home is located at 12 Reynolds Farm Ln, New Milford, CT 06776 and is currently estimated at $594,836, approximately $257 per square foot. 12 Reynolds Farm Ln is a home located in Litchfield County with nearby schools including Sarah Noble Intermediate School, Hill And Plain Elementary School, and Schaghticoke Middle School.
Ownership History
Date
Name
Owned For
Owner Type
Purchase Details
Closed on
Aug 4, 1998
Sold by
Fordyce Assoc
Bought by
Bell Randy and Bell Maureen
Current Estimated Value
Create a Home Valuation Report for This Property
The Home Valuation Report is an in-depth analysis detailing your home's value as well as a comparison with similar homes in the area
Home Values in the Area
Average Home Value in this Area
Purchase History
| Date | Buyer | Sale Price | Title Company |
|---|---|---|---|
| Bell Randy | $239,000 | -- |
Source: Public Records
Mortgage History
| Date | Status | Borrower | Loan Amount |
|---|---|---|---|
| Open | Bell Randy | $306,068 | |
| Closed | Bell Randy | $315,000 | |
| Closed | Bell Randy | $75,000 | |
| Closed | Bell Randy | $265,000 |
Source: Public Records
Tax History Compared to Growth
Tax History
| Year | Tax Paid | Tax Assessment Tax Assessment Total Assessment is a certain percentage of the fair market value that is determined by local assessors to be the total taxable value of land and additions on the property. | Land | Improvement |
|---|---|---|---|---|
| 2025 | $11,448 | $248,410 | $80,970 | $167,440 |
| 2024 | $7,395 | $248,410 | $80,970 | $167,440 |
| 2023 | $7,199 | $248,410 | $80,970 | $167,440 |
| 2022 | $7,042 | $248,410 | $80,970 | $167,440 |
| 2021 | $6,948 | $248,410 | $80,970 | $167,440 |
| 2020 | $6,742 | $235,060 | $78,120 | $156,940 |
| 2019 | $6,746 | $235,060 | $78,120 | $156,940 |
| 2018 | $6,622 | $235,060 | $78,120 | $156,940 |
| 2017 | $6,405 | $235,060 | $78,120 | $156,940 |
| 2016 | $6,291 | $234,990 | $78,120 | $156,870 |
| 2015 | $6,383 | $238,630 | $78,120 | $160,510 |
| 2014 | $6,276 | $238,630 | $78,120 | $160,510 |
Source: Public Records
Map
Nearby Homes
- 112 Beard Dr Unit 112
- 15 Legion Rd
- 23 Valley View Ln
- 143 Beard Dr
- 63 Fordyce Rd
- 31 Bostwick Arms Unit 31
- 18 Outlook Rd
- 45 West St Unit 15
- 24 Whittlesey Ave
- 5 N Brook Hollow Dr S
- 183 Second Hill Rd
- 6 High Meadow Rd
- 128 Old Farms Ln
- 29 Sherwood Dr
- 57 Second Hill Rd
- 5 Tanglewood Ln
- 31 Caldwell Dr
- 5 Dahle Rd
- 6 Wishing Well Ln Unit 6
- 80 Glen Ridge Ct
- 10 Reynolds Farm Ln
- 16 Reynolds Farm Ln
- 15 Reynolds Farm Ln
- 17 Reynolds Farm Ln
- 11 Reynolds Farm Ln
- 17 Reynolds Farm Rd
- 13 Reynolds Farm Ln
- 2 Melissa Ln
- 8 Melissa Ln
- 5 Melissa Ln
- 21 Chicken Hill Ln
- 7 Melissa Ln
- 3 Melissa Ln
- 9 Melissa Ln
- 19 Chicken Hill Ln
- 7 Chandler Ln
- 40 Legion Rd
- 26 Reynolds Farm Ln
- 29 Reynolds Farm Ln
- 24 Reynolds Farm Rd