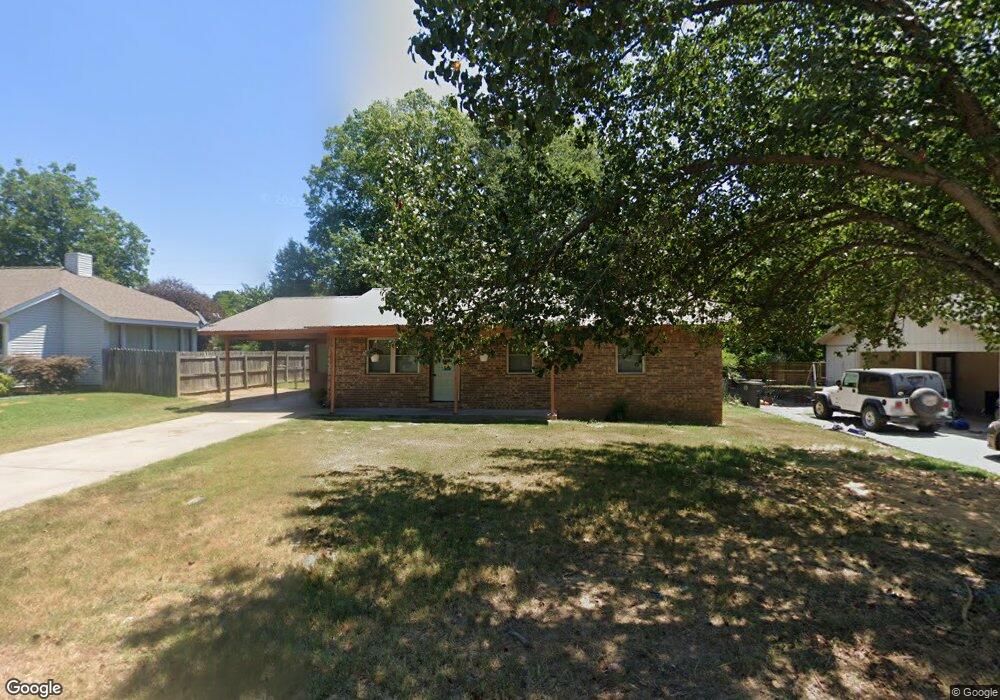
12 Robbye Ln Searcy, AR 72143
Estimated Value: $123,000 - $152,000
3
Beds
1
Bath
1,122
Sq Ft
$120/Sq Ft
Est. Value
About This Home
This home is located at 12 Robbye Ln, Searcy, AR 72143 and is currently estimated at $135,177, approximately $120 per square foot. 12 Robbye Ln is a home located in White County with nearby schools including Westside Elementary School, Southwest Middle School, and Ahlf Junior High School.
Ownership History
Date
Name
Owned For
Owner Type
Purchase Details
Closed on
Aug 26, 2023
Sold by
Jjrd Properties Llc
Bought by
Jtd Holdings Llc
Current Estimated Value
Purchase Details
Closed on
Jan 27, 2022
Sold by
Wesley Mccammon Clay and Wesley Christi
Bought by
Jjrd Properties Llc
Home Financials for this Owner
Home Financials are based on the most recent Mortgage that was taken out on this home.
Original Mortgage
$94,625
Interest Rate
3.45%
Mortgage Type
New Conventional
Purchase Details
Closed on
Dec 29, 2010
Sold by
Vandervelde Alex J and Vandervelde Laurette G
Bought by
Mccammon Clay Wesley and Mccammon Christi
Home Financials for this Owner
Home Financials are based on the most recent Mortgage that was taken out on this home.
Original Mortgage
$64,000
Interest Rate
4.36%
Mortgage Type
New Conventional
Purchase Details
Closed on
Dec 19, 1997
Bought by
Vandervelde Alex J and Vandervelde Laurette
Create a Home Valuation Report for This Property
The Home Valuation Report is an in-depth analysis detailing your home's value as well as a comparison with similar homes in the area
Purchase History
| Date | Buyer | Sale Price | Title Company |
|---|---|---|---|
| Jtd Holdings Llc | -- | None Listed On Document | |
| Jjrd Properties Llc | $99,000 | Jordan Steven B | |
| Jjrd Properties Llc | $99,000 | None Listed On Document | |
| Mccammon Clay Wesley | $80,000 | None Available | |
| Vandervelde Alex J | $59,000 | -- |
Source: Public Records
Mortgage History
| Date | Status | Borrower | Loan Amount |
|---|---|---|---|
| Previous Owner | Jjrd Properties Llc | $94,625 | |
| Previous Owner | Mccammon Clay Wesley | $64,000 |
Source: Public Records
Tax History
| Year | Tax Paid | Tax Assessment Tax Assessment Total Assessment is a certain percentage of the fair market value that is determined by local assessors to be the total taxable value of land and additions on the property. | Land | Improvement |
|---|---|---|---|---|
| 2025 | $692 | $17,050 | $3,600 | $13,450 |
| 2024 | $692 | $17,050 | $3,600 | $13,450 |
| 2023 | $692 | $17,050 | $3,600 | $13,450 |
| 2022 | $692 | $17,050 | $3,600 | $13,450 |
| 2021 | $692 | $17,050 | $3,600 | $13,450 |
| 2020 | $675 | $16,630 | $6,000 | $10,630 |
| 2019 | $675 | $16,630 | $6,000 | $10,630 |
| 2018 | $675 | $16,630 | $6,000 | $10,630 |
| 2017 | $594 | $16,630 | $6,000 | $10,630 |
| 2016 | $594 | $14,630 | $6,000 | $8,630 |
| 2015 | $540 | $13,300 | $3,800 | $9,500 |
| 2014 | $540 | $13,300 | $3,800 | $9,500 |
Source: Public Records
Map
Nearby Homes
- 8 Robbye Ln
- 1903 W Arch Ave
- 19 Hartwell Place
- 32 Stoneybrook Ln
- 28 Stoneybrook Ln
- 1806 W Arch Ave
- 42 Stoneybrook Ln
- 2102 Jonathan Ln
- 116 N Sawmill Rd
- 404 S Sawmill Rd
- 0 Stoneybrook Ln
- 00-Lot C W Beebe Capps Expy
- 0 W Beebe Capps Expy Unit 22023380
- 00-Lot A W Beebe Capps Expy
- 00-Lot B W Beebe Capps Expy
- 318 N Sawmill Rd
- 311 N Sawmill Rd
- 50 Sherwood Loop
- 1504 W Center Ave
- 142 John Cyrus Dr
Your Personal Tour Guide
Ask me questions while you tour the home.