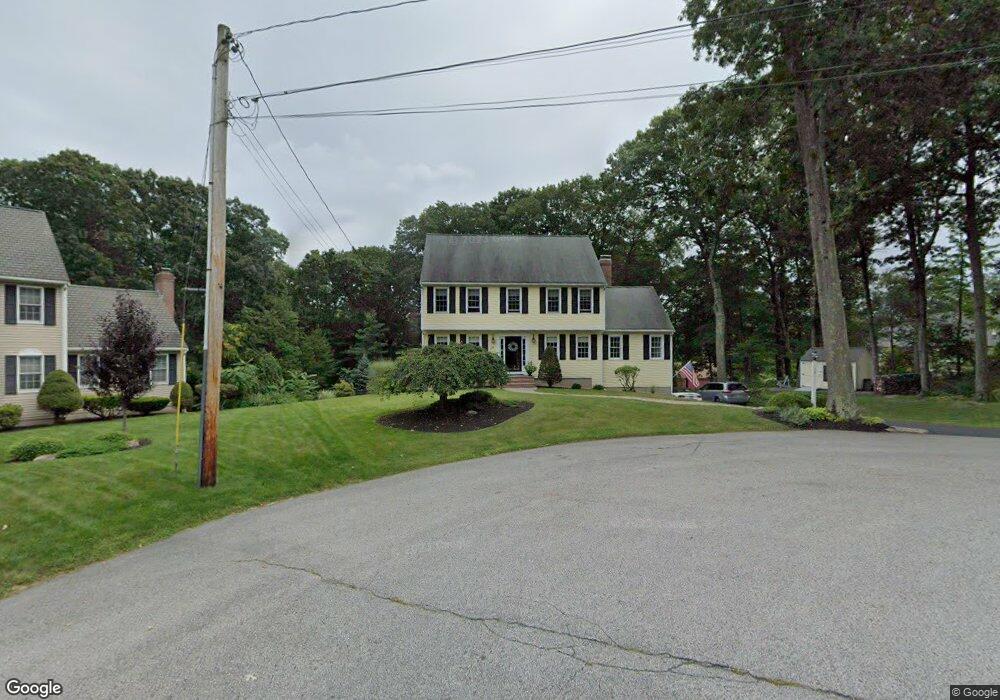
12 Ronald Ln Shrewsbury, MA 01545
Estimated Value: $800,000 - $971,000
3
Beds
3
Baths
2,076
Sq Ft
$415/Sq Ft
Est. Value
About This Home
This home is located at 12 Ronald Ln, Shrewsbury, MA 01545 and is currently estimated at $861,300, approximately $414 per square foot. 12 Ronald Ln is a home located in Worcester County with nearby schools including Spring Street Elementary School, Sherwood Middle School, and Oak Middle School.
Ownership History
Date
Name
Owned For
Owner Type
Purchase Details
Closed on
Nov 1, 1996
Sold by
Stone Ridge Dev Inc
Bought by
Badstubner Kurt and Badstubner Eileen
Current Estimated Value
Purchase Details
Closed on
May 10, 1996
Sold by
Nardi James A and Nardi Jean
Bought by
Stone Ridge Dev Inc
Create a Home Valuation Report for This Property
The Home Valuation Report is an in-depth analysis detailing your home's value as well as a comparison with similar homes in the area
Home Values in the Area
Average Home Value in this Area
Purchase History
| Date | Buyer | Sale Price | Title Company |
|---|---|---|---|
| Badstubner Kurt | $225,900 | -- | |
| Badstubner Kurt | $225,900 | -- | |
| Stone Ridge Dev Inc | $210,000 | -- | |
| Stone Ridge Dev Inc | $210,000 | -- |
Source: Public Records
Mortgage History
| Date | Status | Borrower | Loan Amount |
|---|---|---|---|
| Open | Stone Ridge Dev Inc | $84,000 | |
| Open | Stone Ridge Dev Inc | $270,000 |
Source: Public Records
Tax History Compared to Growth
Tax History
| Year | Tax Paid | Tax Assessment Tax Assessment Total Assessment is a certain percentage of the fair market value that is determined by local assessors to be the total taxable value of land and additions on the property. | Land | Improvement |
|---|---|---|---|---|
| 2025 | $89 | $735,200 | $266,900 | $468,300 |
| 2024 | $8,680 | $701,100 | $254,100 | $447,000 |
| 2023 | $8,192 | $624,400 | $254,100 | $370,300 |
| 2022 | $8,013 | $567,900 | $254,100 | $313,800 |
| 2021 | $6,549 | $496,500 | $203,300 | $293,200 |
| 2020 | $6,199 | $497,100 | $203,300 | $293,800 |
| 2019 | $5,658 | $450,100 | $187,400 | $262,700 |
| 2018 | $5,691 | $449,500 | $180,200 | $269,300 |
| 2017 | $5,427 | $423,000 | $163,800 | $259,200 |
| 2016 | $5,446 | $418,900 | $154,100 | $264,800 |
| 2015 | $5,396 | $408,800 | $149,500 | $259,300 |
Source: Public Records
Map
Nearby Homes