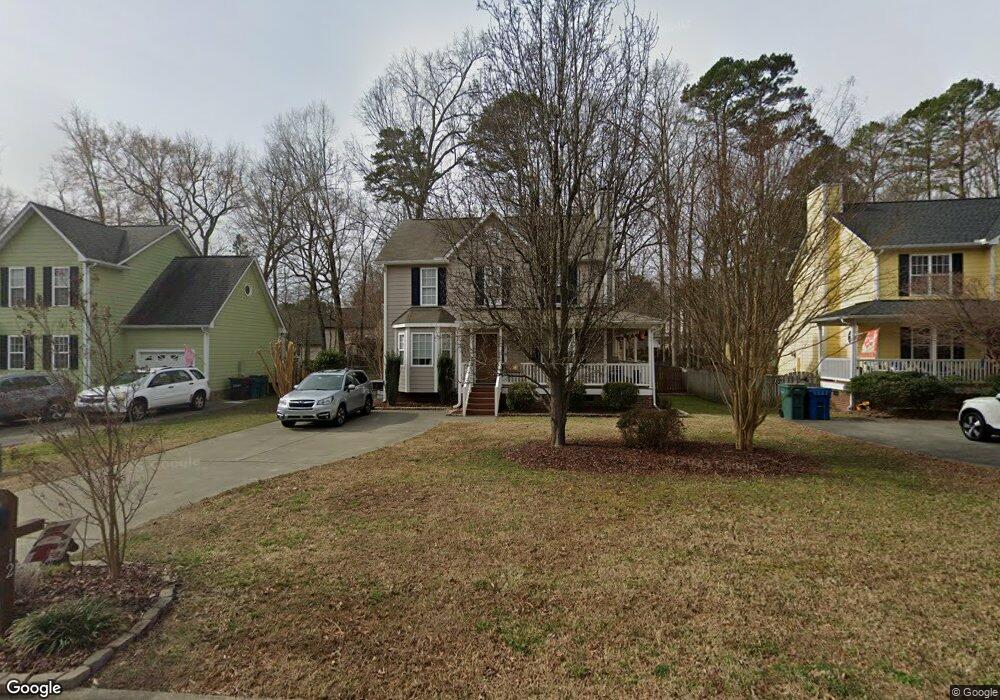
12 Round Spring Ln Durham, NC 27712
North Durham NeighborhoodEstimated Value: $357,824 - $373,000
3
Beds
3
Baths
1,452
Sq Ft
$252/Sq Ft
Est. Value
About This Home
This home is located at 12 Round Spring Ln, Durham, NC 27712 and is currently estimated at $366,456, approximately $252 per square foot. 12 Round Spring Ln is a home located in Durham County with nearby schools including Eno Valley Elementary, George L Carrington Middle, and Northern High School.
Ownership History
Date
Name
Owned For
Owner Type
Purchase Details
Closed on
Jun 27, 2024
Sold by
Parker Patricia A
Bought by
Patricia Parker Revocable Living Trust and Parker
Current Estimated Value
Purchase Details
Closed on
Oct 15, 2001
Sold by
James Taylor Inc
Bought by
Parker Patricia A
Home Financials for this Owner
Home Financials are based on the most recent Mortgage that was taken out on this home.
Original Mortgage
$142,800
Interest Rate
6.87%
Mortgage Type
VA
Purchase Details
Closed on
Apr 6, 2001
Sold by
Eno Trace Ltd Partnership
Bought by
James Taylor Inc
Home Financials for this Owner
Home Financials are based on the most recent Mortgage that was taken out on this home.
Original Mortgage
$102,000
Interest Rate
6.99%
Mortgage Type
Construction
Create a Home Valuation Report for This Property
The Home Valuation Report is an in-depth analysis detailing your home's value as well as a comparison with similar homes in the area
Home Values in the Area
Average Home Value in this Area
Purchase History
| Date | Buyer | Sale Price | Title Company |
|---|---|---|---|
| Patricia Parker Revocable Living Trust | -- | None Listed On Document | |
| Parker Patricia A | $140,000 | -- | |
| James Taylor Inc | $96,500 | -- |
Source: Public Records
Mortgage History
| Date | Status | Borrower | Loan Amount |
|---|---|---|---|
| Previous Owner | Parker Patricia A | $142,800 | |
| Previous Owner | James Taylor Inc | $102,000 |
Source: Public Records
Tax History
| Year | Tax Paid | Tax Assessment Tax Assessment Total Assessment is a certain percentage of the fair market value that is determined by local assessors to be the total taxable value of land and additions on the property. | Land | Improvement |
|---|---|---|---|---|
| 2025 | $3,570 | $360,142 | $70,150 | $289,992 |
| 2024 | $2,522 | $180,812 | $36,570 | $144,242 |
| 2023 | $2,368 | $180,812 | $36,570 | $144,242 |
| 2022 | $2,314 | $180,812 | $36,570 | $144,242 |
| 2021 | $2,303 | $180,812 | $36,570 | $144,242 |
| 2020 | $2,249 | $180,812 | $36,570 | $144,242 |
| 2019 | $2,249 | $180,812 | $36,570 | $144,242 |
| 2018 | $2,241 | $165,218 | $24,400 | $140,818 |
| 2017 | $2,225 | $165,218 | $24,400 | $140,818 |
| 2016 | $2,150 | $165,218 | $24,400 | $140,818 |
| 2015 | $2,200 | $158,940 | $27,495 | $131,445 |
| 2014 | $2,200 | $158,940 | $27,495 | $131,445 |
Source: Public Records
Map
Nearby Homes
- 8 Osage Place
- 4311 White Cliff Ln
- 711 Wheat Mill Rd
- 5100 Stardust Dr
- 5422 Whippoorwill St
- 631 Infinity Rd
- 6 Timbercreek Ct
- 115 Windermere Dr Unit 204
- 312 Omega Rd
- 4911 Seterra Bend
- 5412 Peppercorn St
- 4802 Seterra Bend
- 5309 Old Well St
- 7 Neptune Ct
- 601 Weeping Willow Dr
- 705 Felicia St
- 508 Weeping Willow Dr
- 215 Cheryl Ave
- 809 Felicia St
- 2208 Titanium Rock Rd
- 8 Round Spring Ln
- 14 Round Spring Ln
- 6 Round Spring Ln
- 16 Round Spring Ln
- 5 Current Ln
- 11 Current Ln
- 4 Round Spring Ln
- 18 Round Spring Ln
- 13 Round Spring Ln
- 11 Round Spring Ln
- 3 Current Ln
- 15 Round Spring Ln
- 7 Round Spring Ln
- 4233 Lazyriver Dr
- 17 Round Spring Ln
- 22 Round Spring Ln
- 1 Current Ln
- 5 Round Spring Ln
- 15 Current Ln
- 3 Round Spring Ln
Your Personal Tour Guide
Ask me questions while you tour the home.