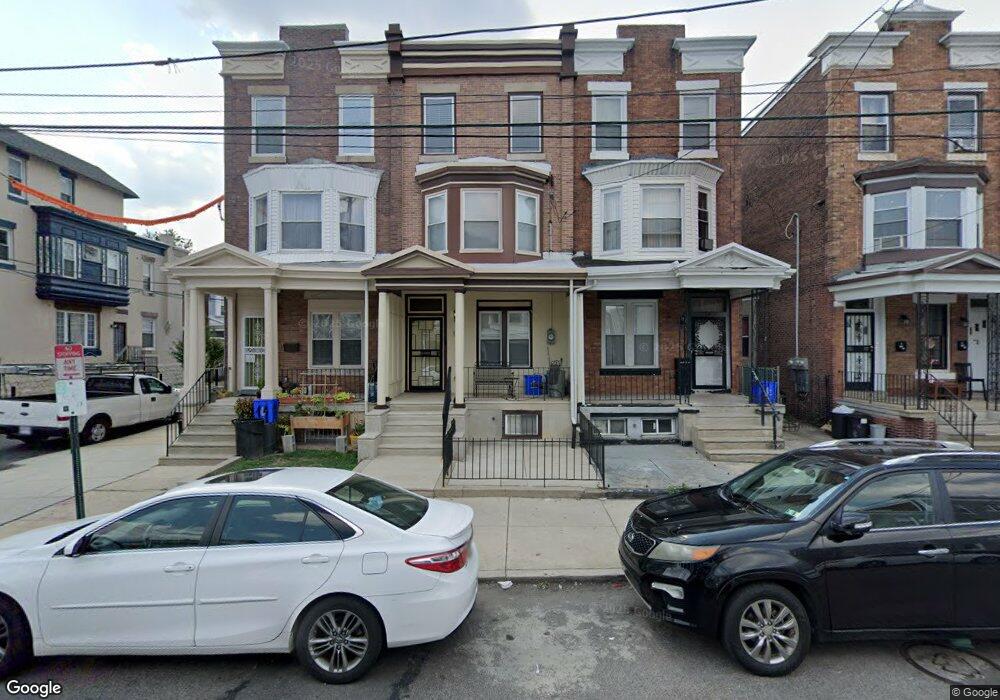
12 S 51st St Philadelphia, PA 19139
Cobbs Creek NeighborhoodEstimated Value: $306,000 - $430,000
--
Bed
--
Bath
1,995
Sq Ft
$178/Sq Ft
Est. Value
About This Home
This home is located at 12 S 51st St, Philadelphia, PA 19139 and is currently estimated at $355,882, approximately $178 per square foot. 12 S 51st St is a home located in Philadelphia County with nearby schools including William L. Sayre High School, Global Leadership Academy Charter School Southwest, and KIPP Philadelphia Octavius Catto CS.
Ownership History
Date
Name
Owned For
Owner Type
Purchase Details
Closed on
May 4, 2005
Sold by
The Partnership Cdc
Bought by
Collier Aliya
Current Estimated Value
Home Financials for this Owner
Home Financials are based on the most recent Mortgage that was taken out on this home.
Original Mortgage
$104,400
Outstanding Balance
$54,463
Interest Rate
6.05%
Mortgage Type
Fannie Mae Freddie Mac
Estimated Equity
$301,419
Purchase Details
Closed on
Jul 2, 2003
Sold by
C O T S Investment Inc
Bought by
The Partnership Cdc
Home Financials for this Owner
Home Financials are based on the most recent Mortgage that was taken out on this home.
Original Mortgage
$30,000
Interest Rate
5.45%
Mortgage Type
Unknown
Purchase Details
Closed on
Aug 23, 1995
Sold by
Brody Jeff and Levitan Curt
Bought by
C O T S Investment Inc
Create a Home Valuation Report for This Property
The Home Valuation Report is an in-depth analysis detailing your home's value as well as a comparison with similar homes in the area
Home Values in the Area
Average Home Value in this Area
Purchase History
| Date | Buyer | Sale Price | Title Company |
|---|---|---|---|
| Collier Aliya | $87,000 | Lawyers Title Ins | |
| The Partnership Cdc | $27,500 | Landamerica Lawyers Title | |
| C O T S Investment Inc | $7,136 | -- |
Source: Public Records
Mortgage History
| Date | Status | Borrower | Loan Amount |
|---|---|---|---|
| Open | Collier Aliya | $104,400 | |
| Previous Owner | The Partnership Cdc | $30,000 |
Source: Public Records
Tax History Compared to Growth
Tax History
| Year | Tax Paid | Tax Assessment Tax Assessment Total Assessment is a certain percentage of the fair market value that is determined by local assessors to be the total taxable value of land and additions on the property. | Land | Improvement |
|---|---|---|---|---|
| 2026 | $5,479 | $402,700 | $80,500 | $322,200 |
| 2025 | $5,479 | $402,700 | $80,500 | $322,200 |
| 2024 | $5,479 | $402,700 | $80,500 | $322,200 |
| 2023 | $5,479 | $391,400 | $78,280 | $313,120 |
| 2022 | $2,590 | $346,400 | $78,280 | $268,120 |
| 2021 | $3,220 | $0 | $0 | $0 |
| 2020 | $3,220 | $0 | $0 | $0 |
| 2019 | $3,099 | $0 | $0 | $0 |
| 2018 | $1,988 | $0 | $0 | $0 |
| 2017 | $4,583 | $0 | $0 | $0 |
| 2016 | $4,583 | $0 | $0 | $0 |
| 2015 | $1,379 | $0 | $0 | $0 |
| 2014 | -- | $187,500 | $14,351 | $173,149 |
| 2012 | -- | $14,400 | $2,219 | $12,181 |
Source: Public Records
Map
Nearby Homes
- 5112 Ranstead St
- 23 S 51st St
- 5131 Ludlow St
- 5136 Ludlow St
- 5136 Ranstead St
- 5140 Ranstead St
- 5144 Ranstead St
- 5149 Ranstead St
- 5031 Ludlow St
- 27 N 51st St
- 5014 Chestnut St
- 43 N Dearborn St
- 59 N Dearborn St
- 5231 Sansom St
- 19 N 50th St
- 38 N 50th St
- 131 S 50th St
- 5005 Walnut St
- 5107 Chancellor St
- 7 S 53rd St