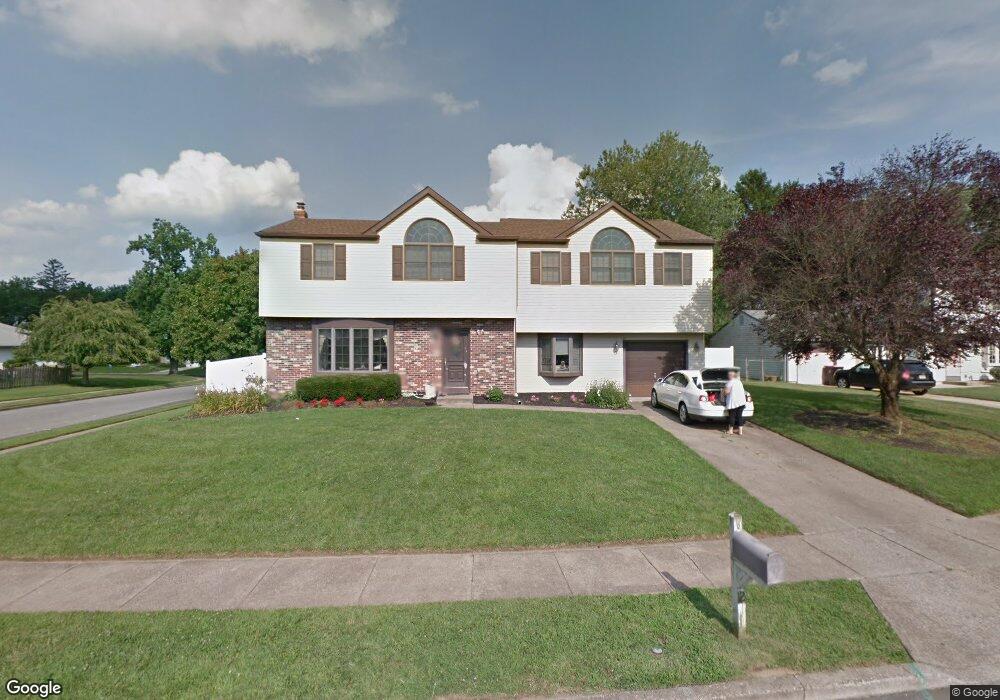
12 S Betsy Ct Glendora, NJ 08029
Estimated Value: $440,577 - $510,000
--
Bed
--
Bath
2,500
Sq Ft
$189/Sq Ft
Est. Value
About This Home
This home is located at 12 S Betsy Ct, Glendora, NJ 08029 and is currently estimated at $473,144, approximately $189 per square foot. 12 S Betsy Ct is a home located in Camden County with nearby schools including Glen Landing Middle School, Triton High School, and St. Teresa Regional School.
Ownership History
Date
Name
Owned For
Owner Type
Purchase Details
Closed on
Oct 26, 2004
Sold by
Luca Robert J De
Bought by
Obrien Gary S and Obrien Nancy M
Current Estimated Value
Home Financials for this Owner
Home Financials are based on the most recent Mortgage that was taken out on this home.
Original Mortgage
$185,000
Interest Rate
5.81%
Create a Home Valuation Report for This Property
The Home Valuation Report is an in-depth analysis detailing your home's value as well as a comparison with similar homes in the area
Home Values in the Area
Average Home Value in this Area
Purchase History
| Date | Buyer | Sale Price | Title Company |
|---|---|---|---|
| Obrien Gary S | $240,000 | -- |
Source: Public Records
Mortgage History
| Date | Status | Borrower | Loan Amount |
|---|---|---|---|
| Previous Owner | Obrien Gary S | $185,000 |
Source: Public Records
Tax History Compared to Growth
Tax History
| Year | Tax Paid | Tax Assessment Tax Assessment Total Assessment is a certain percentage of the fair market value that is determined by local assessors to be the total taxable value of land and additions on the property. | Land | Improvement |
|---|---|---|---|---|
| 2025 | $11,740 | $277,800 | $62,000 | $215,800 |
| 2024 | $11,348 | $277,800 | $62,000 | $215,800 |
| 2023 | $11,348 | $277,800 | $62,000 | $215,800 |
| 2022 | $11,287 | $277,800 | $62,000 | $215,800 |
| 2021 | $11,051 | $277,800 | $62,000 | $215,800 |
| 2020 | $11,059 | $277,800 | $62,000 | $215,800 |
| 2019 | $10,815 | $277,800 | $62,000 | $215,800 |
| 2018 | $10,768 | $277,800 | $62,000 | $215,800 |
| 2017 | $12,545 | $277,800 | $62,000 | $215,800 |
| 2016 | $10,190 | $277,800 | $62,000 | $215,800 |
| 2015 | $9,459 | $277,800 | $62,000 | $215,800 |
| 2014 | $9,404 | $277,800 | $62,000 | $215,800 |
Source: Public Records
Map
Nearby Homes