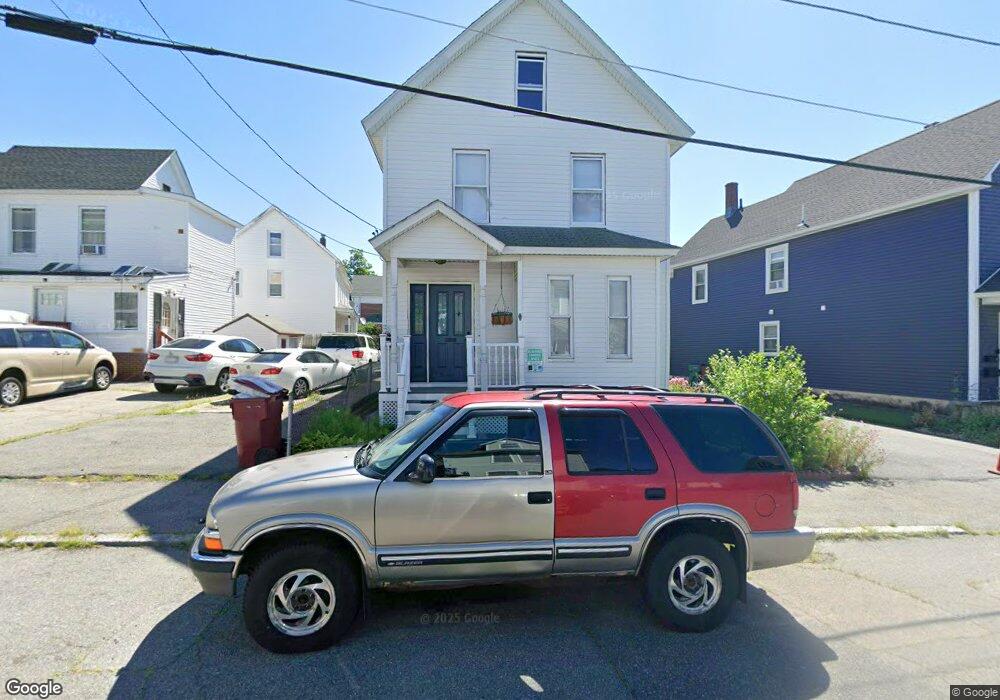
12 S Loring St Lowell, MA 01851
Lower Highlands NeighborhoodEstimated Value: $489,000 - $685,000
3
Beds
2
Baths
2,336
Sq Ft
$247/Sq Ft
Est. Value
About This Home
This home is located at 12 S Loring St, Lowell, MA 01851 and is currently estimated at $576,498, approximately $246 per square foot. 12 S Loring St is a home located in Middlesex County with nearby schools including Charles W. Morey Elementary School, Abraham Lincoln Elementary School, and Dr. Gertrude Bailey Elementary School.
Ownership History
Date
Name
Owned For
Owner Type
Purchase Details
Closed on
Sep 29, 2000
Sold by
Hayden William O and Hayden Roberta A
Bought by
Hayden George A and Hayden Susan T
Current Estimated Value
Home Financials for this Owner
Home Financials are based on the most recent Mortgage that was taken out on this home.
Original Mortgage
$104,500
Outstanding Balance
$38,164
Interest Rate
7.94%
Mortgage Type
Purchase Money Mortgage
Estimated Equity
$538,334
Create a Home Valuation Report for This Property
The Home Valuation Report is an in-depth analysis detailing your home's value as well as a comparison with similar homes in the area
Home Values in the Area
Average Home Value in this Area
Purchase History
| Date | Buyer | Sale Price | Title Company |
|---|---|---|---|
| Hayden George A | $110,000 | -- | |
| Hayden George A | $110,000 | -- |
Source: Public Records
Mortgage History
| Date | Status | Borrower | Loan Amount |
|---|---|---|---|
| Open | Hayden George A | $104,500 | |
| Closed | Hayden George A | $104,500 |
Source: Public Records
Tax History Compared to Growth
Tax History
| Year | Tax Paid | Tax Assessment Tax Assessment Total Assessment is a certain percentage of the fair market value that is determined by local assessors to be the total taxable value of land and additions on the property. | Land | Improvement |
|---|---|---|---|---|
| 2025 | $5,616 | $489,200 | $135,700 | $353,500 |
| 2024 | $5,421 | $455,200 | $122,000 | $333,200 |
| 2023 | $5,127 | $412,800 | $106,100 | $306,700 |
| 2022 | $4,896 | $385,800 | $96,500 | $289,300 |
| 2021 | $4,572 | $339,700 | $83,900 | $255,800 |
| 2020 | $4,226 | $316,300 | $73,300 | $243,000 |
| 2019 | $4,062 | $289,300 | $67,900 | $221,400 |
| 2018 | $3,930 | $273,100 | $61,800 | $211,300 |
| 2017 | $3,749 | $251,300 | $56,100 | $195,200 |
| 2016 | $3,520 | $232,200 | $53,500 | $178,700 |
| 2015 | $3,141 | $202,900 | $54,700 | $148,200 |
| 2013 | $2,916 | $194,300 | $65,400 | $128,900 |
Source: Public Records
Map
Nearby Homes