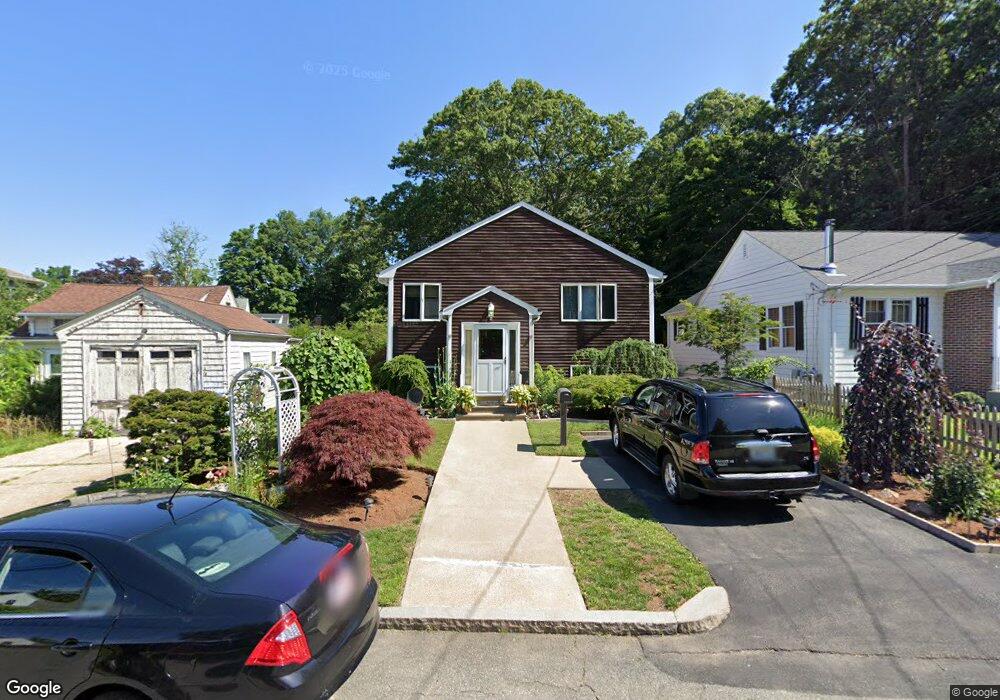
12 Saint Thomas St North Providence, RI 02911
Manton NeighborhoodEstimated Value: $420,000 - $498,000
2
Beds
2
Baths
1,932
Sq Ft
$233/Sq Ft
Est. Value
About This Home
This home is located at 12 Saint Thomas St, North Providence, RI 02911 and is currently estimated at $450,867, approximately $233 per square foot. 12 Saint Thomas St is a home located in Providence County with nearby schools including Charles N. Fortes Elementary School, Asa Messer Elementary School, and Laurel Hill Annex School.
Ownership History
Date
Name
Owned For
Owner Type
Purchase Details
Closed on
Jan 31, 2002
Sold by
Mcelroy Jolin J and Mcelroy Guil P
Bought by
Martineau Raymond G
Current Estimated Value
Home Financials for this Owner
Home Financials are based on the most recent Mortgage that was taken out on this home.
Original Mortgage
$123,318
Interest Rate
7.15%
Create a Home Valuation Report for This Property
The Home Valuation Report is an in-depth analysis detailing your home's value as well as a comparison with similar homes in the area
Home Values in the Area
Average Home Value in this Area
Purchase History
| Date | Buyer | Sale Price | Title Company |
|---|---|---|---|
| Martineau Raymond G | $122,000 | -- |
Source: Public Records
Mortgage History
| Date | Status | Borrower | Loan Amount |
|---|---|---|---|
| Open | Martineau Raymond G | $179,200 | |
| Closed | Martineau Raymond G | $146,000 | |
| Closed | Martineau Raymond G | $136,500 | |
| Closed | Martineau Raymond G | $123,318 |
Source: Public Records
Tax History Compared to Growth
Tax History
| Year | Tax Paid | Tax Assessment Tax Assessment Total Assessment is a certain percentage of the fair market value that is determined by local assessors to be the total taxable value of land and additions on the property. | Land | Improvement |
|---|---|---|---|---|
| 2025 | $4,049 | $482,000 | $155,000 | $327,000 |
| 2024 | $5,986 | $326,200 | $89,700 | $236,500 |
| 2023 | $5,986 | $326,200 | $89,700 | $236,500 |
| 2022 | $5,806 | $326,200 | $89,700 | $236,500 |
| 2021 | $5,317 | $216,500 | $55,600 | $160,900 |
| 2020 | $5,317 | $216,500 | $55,600 | $160,900 |
| 2019 | $5,317 | $216,500 | $55,600 | $160,900 |
| 2018 | $5,567 | $174,200 | $50,500 | $123,700 |
| 2017 | $5,567 | $174,200 | $50,500 | $123,700 |
| 2016 | $5,567 | $174,200 | $50,500 | $123,700 |
| 2015 | $4,889 | $147,700 | $50,500 | $97,200 |
| 2014 | $4,985 | $147,700 | $50,500 | $97,200 |
| 2013 | $5,103 | $151,200 | $50,500 | $100,700 |
Source: Public Records
Map
Nearby Homes
- 17 Woonasquatucket Ave
- 95 Rowley St
- 18 Allendale Ave
- 60 Rowley St
- 0 Elm St
- 44 Herschel St
- 87 Lyman Ave
- 25 Devereux St Unit 205
- 17 Packard Ave Unit B-1-105
- 24 Iris Ln
- 7 Laurel St
- 11 Glen St
- 11 Lyman Ave
- 11 Springfield Ave
- 10 Sadler St
- 35 Hedley Ave
- 0 Jackson Ave
- 2 Fairmount Ave
- 11 Traver Ave Unit 1
- 11 Brinkley St
- 14 Saint Thomas St
- 10 Saint Thomas St Unit A3
- 10 Saint Thomas St
- 10 Saint Thomas St Unit A2
- 10 Saint Thomas St Unit 2
- 187 Fruit Hill Ave
- 177 Fruit Hill Ave
- 189 Fruit Hill Ave
- 189 Fruit Hill Ave
- 13 Saint Thomas St
- 191 Fruit Hill Ave
- 191 Fruit Hill Ave Unit 2
- 163 Fruit Hill Ave
- 184 Fruit Hill Ave
- 155 Fruit Hill Ave
- 188 Fruit Hill Ave
- 188 Fruit Hill Ave Unit 1
- 178 Fruit Hill Ave
- 170 Fruit Hill Ave
- 196 Fruit Hill Ave