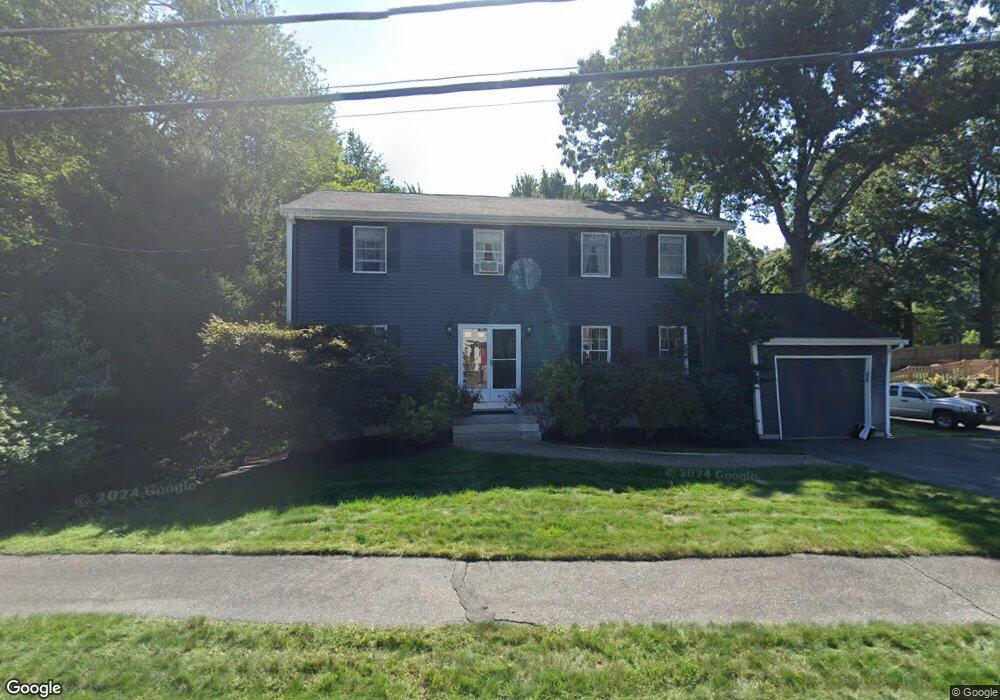
12 Sanborn Ln Reading, MA 01867
Estimated Value: $1,004,000 - $1,595,000
4
Beds
3
Baths
2,080
Sq Ft
$569/Sq Ft
Est. Value
About This Home
This home is located at 12 Sanborn Ln, Reading, MA 01867 and is currently estimated at $1,184,241, approximately $569 per square foot. 12 Sanborn Ln is a home located in Middlesex County with nearby schools including Wood End Elementary School, Arthur W. Coolidge Middle School, and Reading Memorial High School.
Ownership History
Date
Name
Owned For
Owner Type
Purchase Details
Closed on
Aug 1, 1988
Sold by
Frank Michael R
Bought by
Worden Robt H
Current Estimated Value
Home Financials for this Owner
Home Financials are based on the most recent Mortgage that was taken out on this home.
Original Mortgage
$185,000
Interest Rate
10.39%
Mortgage Type
Purchase Money Mortgage
Create a Home Valuation Report for This Property
The Home Valuation Report is an in-depth analysis detailing your home's value as well as a comparison with similar homes in the area
Home Values in the Area
Average Home Value in this Area
Purchase History
| Date | Buyer | Sale Price | Title Company |
|---|---|---|---|
| Worden Robt H | $285,000 | -- |
Source: Public Records
Mortgage History
| Date | Status | Borrower | Loan Amount |
|---|---|---|---|
| Open | Worden Robt H | $176,000 | |
| Closed | Worden Robt H | $185,000 |
Source: Public Records
Tax History
| Year | Tax Paid | Tax Assessment Tax Assessment Total Assessment is a certain percentage of the fair market value that is determined by local assessors to be the total taxable value of land and additions on the property. | Land | Improvement |
|---|---|---|---|---|
| 2025 | $11,801 | $1,036,100 | $592,900 | $443,200 |
| 2024 | $11,946 | $1,019,300 | $583,300 | $436,000 |
| 2023 | $11,242 | $892,900 | $510,900 | $382,000 |
| 2022 | $11,228 | $842,300 | $482,000 | $360,300 |
| 2021 | $10,799 | $782,000 | $441,100 | $340,900 |
| 2020 | $10,372 | $743,500 | $419,400 | $324,100 |
| 2019 | $9,941 | $698,600 | $394,100 | $304,500 |
| 2018 | $6,851 | $653,800 | $368,800 | $285,000 |
| 2017 | $8,992 | $640,900 | $361,500 | $279,400 |
| 2016 | $9,210 | $635,200 | $328,100 | $307,100 |
| 2015 | $8,526 | $580,000 | $299,600 | $280,400 |
| 2014 | $8,464 | $574,200 | $296,600 | $277,600 |
Source: Public Records
Map
Nearby Homes
- 68 Sanborn Ln
- 42 Main St Unit 22
- 36 Main St Unit 1
- 28 Nutter Rd
- 32 Granger Ave
- 16 Briarwood Ave
- 11 Clover Cir Unit A
- 119 Van Norden Rd
- 43 Ashley Place
- 50 Forest St
- 10 Meadow Brook Ln
- 0 Charles St Unit 72374573
- 150 Grove St
- 18 Symonds Way
- 99 Grove St
- 114 Haverhill St
- 1 Greenbriar Dr Unit 303
- 2 Greenbriar Dr Unit 205
- 3 Greenbriar Dr Unit 106
- 3 Greenbriar Dr Unit 303
Your Personal Tour Guide
Ask me questions while you tour the home.