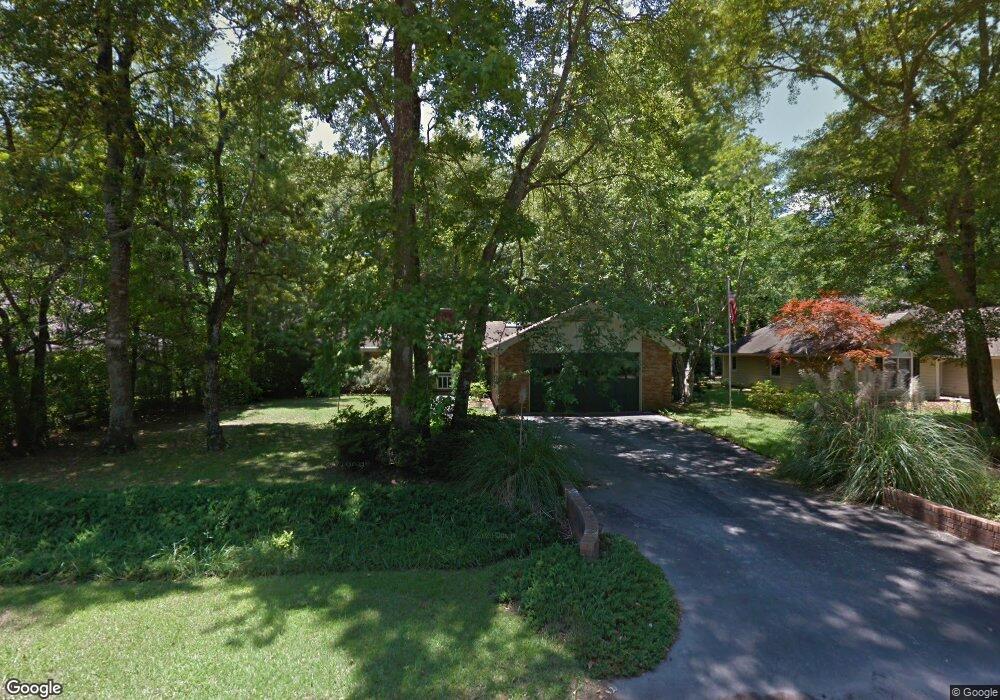
12 Sanddollar Ct Carolina Shores, NC 28467
Estimated Value: $302,808 - $339,000
3
Beds
2
Baths
1,846
Sq Ft
$174/Sq Ft
Est. Value
About This Home
This home is located at 12 Sanddollar Ct, Carolina Shores, NC 28467 and is currently estimated at $321,702, approximately $174 per square foot. 12 Sanddollar Ct is a home located in Brunswick County with nearby schools including Jessie Mae Monroe Elementary School, Shallotte Middle School, and West Brunswick High School.
Ownership History
Date
Name
Owned For
Owner Type
Purchase Details
Closed on
Apr 19, 2023
Sold by
Fedorczyk John
Bought by
Thompson Charles M and Thompson Tina R
Current Estimated Value
Home Financials for this Owner
Home Financials are based on the most recent Mortgage that was taken out on this home.
Original Mortgage
$226,500
Outstanding Balance
$218,129
Interest Rate
5%
Mortgage Type
New Conventional
Estimated Equity
$103,573
Purchase Details
Closed on
Feb 6, 2023
Sold by
Harkins Carol B
Bought by
Fedorczyk John
Home Financials for this Owner
Home Financials are based on the most recent Mortgage that was taken out on this home.
Original Mortgage
$159,200
Interest Rate
6.48%
Mortgage Type
New Conventional
Purchase Details
Closed on
Nov 1, 2002
Bought by
Harkins Carol B
Create a Home Valuation Report for This Property
The Home Valuation Report is an in-depth analysis detailing your home's value as well as a comparison with similar homes in the area
Home Values in the Area
Average Home Value in this Area
Purchase History
| Date | Buyer | Sale Price | Title Company |
|---|---|---|---|
| Thompson Charles M | $305,000 | None Listed On Document | |
| Thompson Charles M | $305,000 | None Listed On Document | |
| Fedorczyk John | $199,000 | -- | |
| Harkins Carol B | $166,000 | -- |
Source: Public Records
Mortgage History
| Date | Status | Borrower | Loan Amount |
|---|---|---|---|
| Open | Thompson Charles M | $226,500 | |
| Closed | Thompson Charles M | $226,500 | |
| Previous Owner | Fedorczyk John | $159,200 |
Source: Public Records
Tax History Compared to Growth
Tax History
| Year | Tax Paid | Tax Assessment Tax Assessment Total Assessment is a certain percentage of the fair market value that is determined by local assessors to be the total taxable value of land and additions on the property. | Land | Improvement |
|---|---|---|---|---|
| 2025 | $1,515 | $297,520 | $29,000 | $268,520 |
| 2024 | $1,515 | $297,520 | $29,000 | $268,520 |
| 2023 | $1,203 | $297,520 | $29,000 | $268,520 |
| 2022 | $1,203 | $170,920 | $25,000 | $145,920 |
| 2021 | $1,203 | $170,920 | $25,000 | $145,920 |
| 2020 | $1,159 | $170,920 | $25,000 | $145,920 |
| 2019 | $1,159 | $26,300 | $25,000 | $1,300 |
| 2018 | $1,001 | $21,570 | $20,000 | $1,570 |
| 2017 | $1,001 | $21,570 | $20,000 | $1,570 |
| 2016 | $976 | $21,570 | $20,000 | $1,570 |
| 2015 | $976 | $149,260 | $20,000 | $129,260 |
| 2014 | $979 | $161,465 | $35,000 | $126,465 |
Source: Public Records
Map
Nearby Homes
- 7 Sand Dollar Ct
- 98 Calabash Dr
- 9 Sand Dollar Dr
- 17 Calabash Dr
- 411 Deer Path
- 3 Brassie Dr
- 481 Deer Path
- 25 Pinewood Dr
- 634 Persimmon Rd SW
- 1238 Calabash Station Blvd NW
- 1159 Forest Bend Dr NW
- 1041 Rosefield Way NW
- 1259 Calabash Station Blvd NW
- 1214 Calabash Station Blvd NW
- 1246 Calabash Station Blvd NW
- 1230 Calabash Station Blvd NW
- 1155 Forest Bend Dr NW
- 1105 Forest Bend Dr NW
- 1045 Rosefield Way NW Unit Lot 38
- 1263 Calabash Station Blvd NW
- 10 Sanddollar Ct
- 8836 Ladson Ln NW
- 8849 Ladson Ln NW
- 8857 Ladson Ln NW
- 9090 Little Osprey Dr Unit 124
- 9049 Little Osprey Dr Unit Lot 112
- 9024 Island Shore Ave Unit Lot 165
- 9045 Little Osprey Dr Unit 111
- 9033 Little Osprey Dr Unit Lot 108
- 9013 Little Osprey Dr Unit Lot 103
- 8850 Ladson Ln NW
- 9005 Little Osprey Dr Unit 101
- 9033 Island Shore Ave
- 8853 Ladson Ln NW
- 8845 Ladson Ln NW
- 8832 Ladson Ln NW
- 8856 Ladson Ln NW
- 8833 Ladson Ln NW
- 8840 Ladson Ln NW