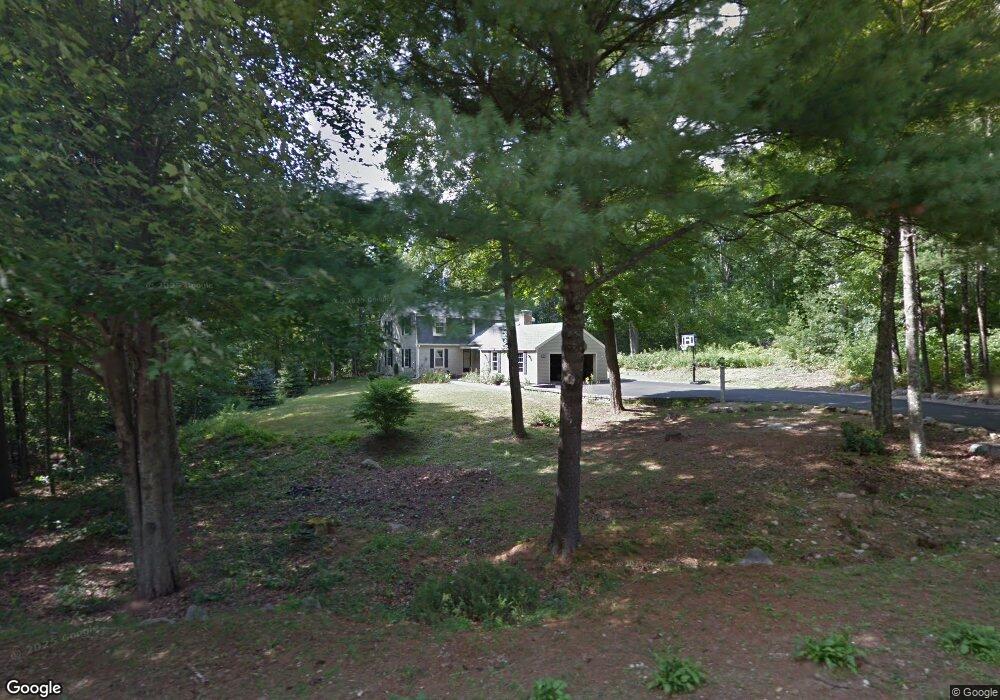
12 Seton Dr Bedford, NH 03110
Bedford NeighborhoodEstimated Value: $755,480 - $898,000
About This Home
This home is located at 12 Seton Dr, Bedford, NH 03110 and is currently estimated at $812,120, approximately $301 per square foot. 12 Seton Dr is a home located in Hillsborough County with nearby schools including Mckelvie Intermediate School, Ross A. Lurgio Middle School, and Bedford High School.
Ownership History
We collect this data history from publicly available records. To have your information removed, we recommend requesting removal directly through your county’s website.
Purchase Details
Purchase Details
Home Financials for this Owner
Home Financials are based on the most recent Mortgage that was taken out on this home.Home Values in the Area
Average Home Value in this Area
Purchase History
We collect this data history from publicly available records. To have your information removed, we recommend requesting removal directly through your county’s website.
| Date | Buyer | Sale Price | Title Company |
|---|---|---|---|
| -- | -- | ||
| $313,500 | -- |
Mortgage History
We collect this data history from publicly available records. To have your information removed, we recommend requesting removal directly through your county’s website.
| Date | Status | Borrower | Loan Amount |
|---|---|---|---|
| Previous Owner | $211,000 | ||
| Previous Owner | $203,500 |
Tax History
We collect this data history from publicly available records. To have your information removed, we recommend requesting removal directly through your county’s website.
| Year | Tax Paid | Tax Assessment Tax Assessment Total Assessment is a certain percentage of the fair market value that is determined by local assessors to be the total taxable value of land and additions on the property. | Land | Improvement |
|---|---|---|---|---|
| 2025 | $10,214 | $619,400 | $243,300 | $376,100 |
| 2024 | $9,793 | $619,400 | $243,300 | $376,100 |
| 2023 | $9,167 | $619,400 | $243,300 | $376,100 |
| 2022 | $8,439 | $479,500 | $180,300 | $299,200 |
| 2021 | $8,219 | $479,500 | $180,300 | $299,200 |
| 2020 | $7,850 | $392,100 | $131,500 | $260,600 |
| 2019 | $7,430 | $392,100 | $131,500 | $260,600 |
| 2018 | $7,566 | $370,900 | $131,500 | $239,400 |
| 2017 | $7,014 | $370,900 | $131,500 | $239,400 |
| 2016 | $7,024 | $314,000 | $104,900 | $209,100 |
| 2015 | $7,147 | $314,000 | $104,900 | $209,100 |
| 2014 | $7,065 | $314,000 | $104,900 | $209,100 |
| 2013 | $6,879 | $310,300 | $104,900 | $205,400 |
Map
- 16 Summit Rd
- 60 Jenkins Rd
- 23 Tumble Rd
- 50 Tumble Rd
- 73 Jenkins Rd
- 31 Gage Rd
- 1 Greenfield Pkwy
- 44 Brick Mill Rd
- 6 Baldwin Ct
- 208 Liberty Hill Rd
- 7 Hamilton Way
- 4 Hunters Rd
- 12 Amber Ln
- 98 Hitching Post Ln
- 46 Veronica Dr
- 78 Meadowcrest Dr
- 29 Old Sawmill Rd
- 15 County Rd
- 20 Rocky Ledge Rd
- 1 Heritage Dr
Ask me questions while you tour the home.