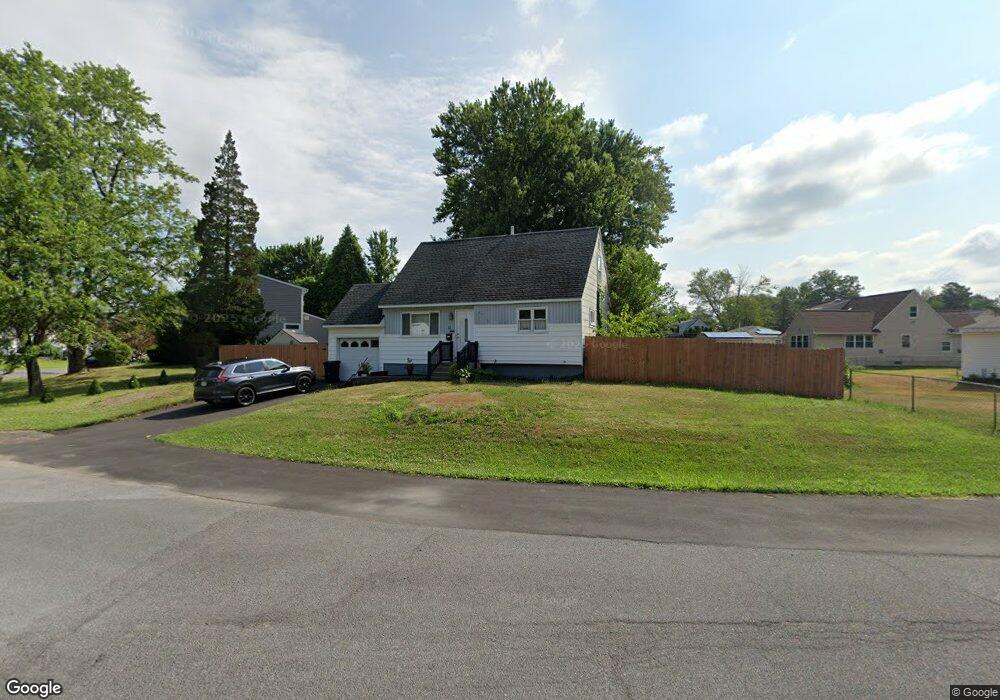
12 Sharon Dr Albany, NY 12205
Estimated Value: $256,000 - $298,000
4
Beds
1
Bath
1,130
Sq Ft
$245/Sq Ft
Est. Value
About This Home
This home is located at 12 Sharon Dr, Albany, NY 12205 and is currently estimated at $276,905, approximately $245 per square foot. 12 Sharon Dr is a home located in Albany County with nearby schools including Forest Park Elementary School, Sand Creek Middle School, and Colonie Central High School.
Ownership History
Date
Name
Owned For
Owner Type
Purchase Details
Closed on
Jan 17, 2007
Sold by
Citone Paul J
Bought by
Chambers Roberta
Current Estimated Value
Purchase Details
Closed on
Sep 11, 2006
Sold by
Citone Paul J
Bought by
Schambers Roberta
Purchase Details
Closed on
Mar 23, 2005
Sold by
Chambers Michael
Bought by
Chambers Roberta
Purchase Details
Closed on
Aug 14, 1996
Sold by
Schrom Theresa
Bought by
Chambers Michael and Chambers Roberta
Purchase Details
Closed on
Oct 6, 1994
Sold by
Curry Ann M
Bought by
Schrom Theresa
Create a Home Valuation Report for This Property
The Home Valuation Report is an in-depth analysis detailing your home's value as well as a comparison with similar homes in the area
Home Values in the Area
Average Home Value in this Area
Purchase History
| Date | Buyer | Sale Price | Title Company |
|---|---|---|---|
| Chambers Roberta | -- | None Available | |
| Schambers Roberta | -- | None Available | |
| Chambers Roberta | -- | -- | |
| Chambers Michael | $91,000 | -- | |
| Schrom Theresa | $88,000 | -- |
Source: Public Records
Tax History
| Year | Tax Paid | Tax Assessment Tax Assessment Total Assessment is a certain percentage of the fair market value that is determined by local assessors to be the total taxable value of land and additions on the property. | Land | Improvement |
|---|---|---|---|---|
| 2024 | $3,597 | $89,500 | $17,900 | $71,600 |
| 2023 | $3,497 | $89,500 | $17,900 | $71,600 |
| 2022 | $3,466 | $89,500 | $17,900 | $71,600 |
| 2021 | $3,414 | $89,500 | $17,900 | $71,600 |
| 2020 | $5,543 | $89,500 | $17,900 | $71,600 |
| 2019 | $2,012 | $89,500 | $17,900 | $71,600 |
| 2018 | $5,446 | $89,500 | $17,900 | $71,600 |
| 2017 | $0 | $89,500 | $17,900 | $71,600 |
| 2016 | $5,364 | $89,500 | $17,900 | $71,600 |
| 2015 | -- | $89,500 | $17,900 | $71,600 |
| 2014 | -- | $89,500 | $17,900 | $71,600 |
Source: Public Records
Map
Nearby Homes
- 0 Forest Rd Unit KEY957052
- 16 Forest Dr
- 2 Delafield Dr
- 6 Jo Ann Ct
- 8 Fuller Terrace
- 25 Fuller Terrace
- 17 Benjamin Ln
- 40 Killean Park
- 5 Lockrow Blvd
- 22 Rapp Rd
- 27 Donna Dr
- 16 Rapple Dr
- 12 Arcadia Ct
- 57 Bridle Path
- 25 Pine St
- 1103 Greenwich Dr
- 1307 Greenwich Dr
- 9 Elmhurst Ave
- 11 Hillside Ave
- 28 Rooney Ave
Your Personal Tour Guide
Ask me questions while you tour the home.