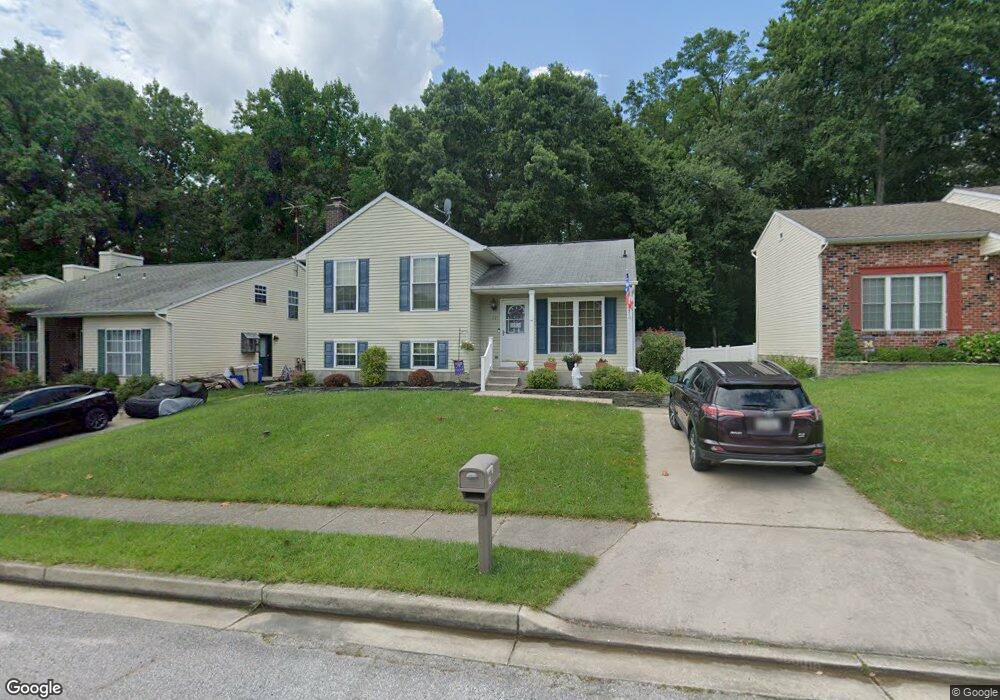
12 Shawn Ct Nottingham, MD 21236
Estimated Value: $345,000 - $482,000
Studio
3
Baths
1,938
Sq Ft
$214/Sq Ft
Est. Value
About This Home
This home is located at 12 Shawn Ct, Nottingham, MD 21236 and is currently estimated at $414,579, approximately $213 per square foot. 12 Shawn Ct is a home located in Baltimore County with nearby schools including Honeygo Elementary School, Perry Hall Middle School, and Perry Hall High School.
Ownership History
Date
Name
Owned For
Owner Type
Purchase Details
Closed on
Oct 4, 2006
Sold by
Matthews Lewis R
Bought by
Englund Todd and Englund Joanne
Current Estimated Value
Home Financials for this Owner
Home Financials are based on the most recent Mortgage that was taken out on this home.
Original Mortgage
$210,000
Outstanding Balance
$125,864
Interest Rate
6.54%
Mortgage Type
Purchase Money Mortgage
Estimated Equity
$288,715
Purchase Details
Closed on
Sep 22, 2006
Sold by
Matthews Lewis R
Bought by
Englund Todd and Englund Joanne
Home Financials for this Owner
Home Financials are based on the most recent Mortgage that was taken out on this home.
Original Mortgage
$210,000
Outstanding Balance
$125,864
Interest Rate
6.54%
Mortgage Type
Purchase Money Mortgage
Estimated Equity
$288,715
Purchase Details
Closed on
May 13, 1985
Sold by
Marsiglia Vincent C
Bought by
Matthews Lewis R 3Rd
Create a Home Valuation Report for This Property
The Home Valuation Report is an in-depth analysis detailing your home's value as well as a comparison with similar homes in the area
Home Values in the Area
Average Home Value in this Area
Purchase History
| Date | Buyer | Sale Price | Title Company |
|---|---|---|---|
| Englund Todd | $320,000 | -- | |
| Englund Todd | $320,000 | -- | |
| Matthews Lewis R 3Rd | $95,000 | -- |
Source: Public Records
Mortgage History
| Date | Status | Borrower | Loan Amount |
|---|---|---|---|
| Open | Englund Todd | $210,000 | |
| Closed | Englund Todd | $210,000 |
Source: Public Records
Tax History
| Year | Tax Paid | Tax Assessment Tax Assessment Total Assessment is a certain percentage of the fair market value that is determined by local assessors to be the total taxable value of land and additions on the property. | Land | Improvement |
|---|---|---|---|---|
| 2025 | $4,480 | $326,767 | -- | -- |
| 2024 | $4,480 | $314,133 | $0 | $0 |
| 2023 | $2,150 | $301,500 | $88,600 | $212,900 |
| 2022 | $4,221 | $294,667 | $0 | $0 |
| 2021 | $4,022 | $287,833 | $0 | $0 |
| 2020 | $4,022 | $281,000 | $88,600 | $192,400 |
| 2019 | $3,889 | $270,900 | $0 | $0 |
| 2018 | $3,913 | $260,800 | $0 | $0 |
| 2017 | $4,164 | $250,700 | $0 | $0 |
| 2016 | $3,807 | $248,833 | $0 | $0 |
| 2015 | $3,807 | $246,967 | $0 | $0 |
| 2014 | $3,807 | $245,100 | $0 | $0 |
Source: Public Records
Map
Nearby Homes
- 24 Shawn Ct
- 4401 E Joppa Rd
- 9202 Santa Rita Rd
- 4516 E Joppa Rd
- 9221 Greenhouse Cir
- 4300 Camellia Rd
- 11 Offspring Ct
- 9212 Snyder Ln
- 4410 Vale Dr
- 5 Farwell Ct
- 9223 Sandra Park Rd
- 9228 Bowline Rd
- 12 Cardor Ct Unit 101
- 12 Cardor Ct Unit 100
- 4833 Grandiflora Cir
- 4503 Hershey Way
- 4831 Grandiflora Cir
- 4829 Grandiflora Cir
- 4827 Grandiflora Cir
- 4823 Grandiflora Cir
Your Personal Tour Guide
Ask me questions while you tour the home.