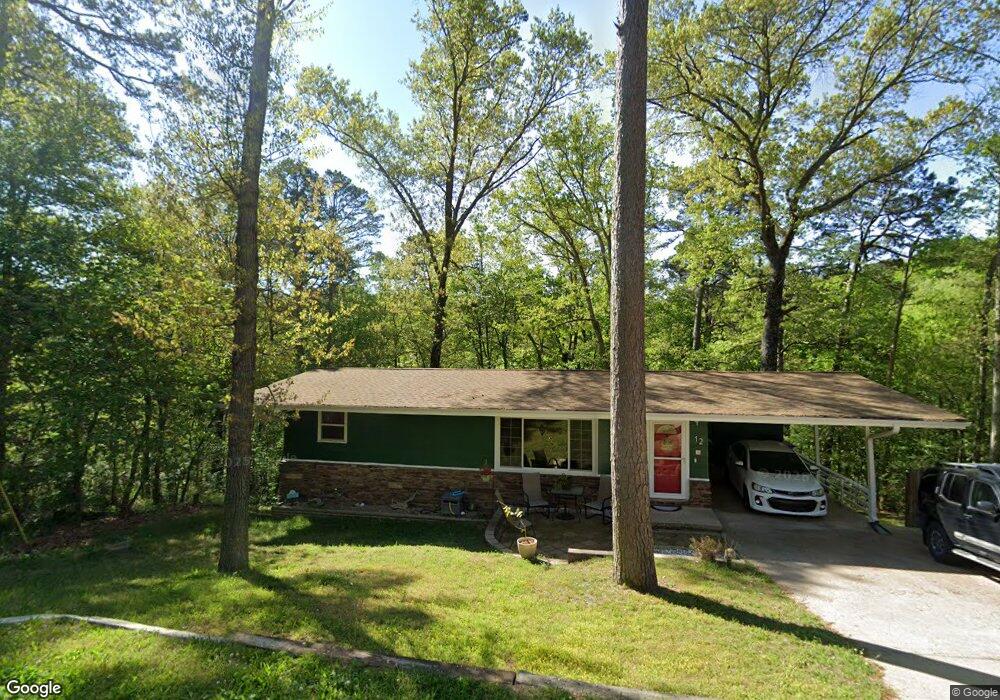
12 Sheneman Dr Bella Vista, AR 72715
Estimated Value: $178,000 - $243,000
2
Beds
1
Bath
960
Sq Ft
$218/Sq Ft
Est. Value
About This Home
This home is located at 12 Sheneman Dr, Bella Vista, AR 72715 and is currently estimated at $209,395, approximately $218 per square foot. 12 Sheneman Dr is a home located in Benton County with nearby schools including Cooper Elementary School, Old High Middle School, and Washington Junior High School.
Ownership History
Date
Name
Owned For
Owner Type
Purchase Details
Closed on
Oct 17, 2014
Sold by
Anderson Roni M and Ray Roni M
Bought by
Anderson Jesse Q and Anderson Roni M
Current Estimated Value
Home Financials for this Owner
Home Financials are based on the most recent Mortgage that was taken out on this home.
Original Mortgage
$39,648
Outstanding Balance
$30,938
Interest Rate
4.75%
Mortgage Type
FHA
Estimated Equity
$178,457
Purchase Details
Closed on
Feb 16, 2009
Sold by
Ray Rodney W and Ray Roni M
Bought by
Ray Roni M
Purchase Details
Closed on
Jun 28, 2002
Bought by
Ray
Purchase Details
Closed on
Apr 12, 1996
Bought by
Dean
Create a Home Valuation Report for This Property
The Home Valuation Report is an in-depth analysis detailing your home's value as well as a comparison with similar homes in the area
Home Values in the Area
Average Home Value in this Area
Purchase History
| Date | Buyer | Sale Price | Title Company |
|---|---|---|---|
| Anderson Jesse Q | -- | None Available | |
| Ray Roni M | -- | None Available | |
| Ray | $51,000 | -- | |
| Dean | $41,000 | -- |
Source: Public Records
Mortgage History
| Date | Status | Borrower | Loan Amount |
|---|---|---|---|
| Open | Anderson Jesse Q | $39,648 |
Source: Public Records
Tax History Compared to Growth
Tax History
| Year | Tax Paid | Tax Assessment Tax Assessment Total Assessment is a certain percentage of the fair market value that is determined by local assessors to be the total taxable value of land and additions on the property. | Land | Improvement |
|---|---|---|---|---|
| 2025 | $889 | $26,434 | $1,600 | $24,834 |
| 2024 | $840 | $26,434 | $1,600 | $24,834 |
| 2023 | $801 | $17,300 | $800 | $16,500 |
| 2022 | $415 | $17,300 | $800 | $16,500 |
| 2021 | $378 | $17,300 | $800 | $16,500 |
| 2020 | $348 | $11,350 | $600 | $10,750 |
| 2019 | $348 | $11,350 | $600 | $10,750 |
| 2018 | $373 | $11,350 | $600 | $10,750 |
| 2017 | $346 | $11,350 | $600 | $10,750 |
| 2016 | $346 | $11,350 | $600 | $10,750 |
| 2015 | $660 | $10,950 | $1,000 | $9,950 |
| 2014 | $310 | $10,950 | $1,000 | $9,950 |
Source: Public Records
Map
Nearby Homes