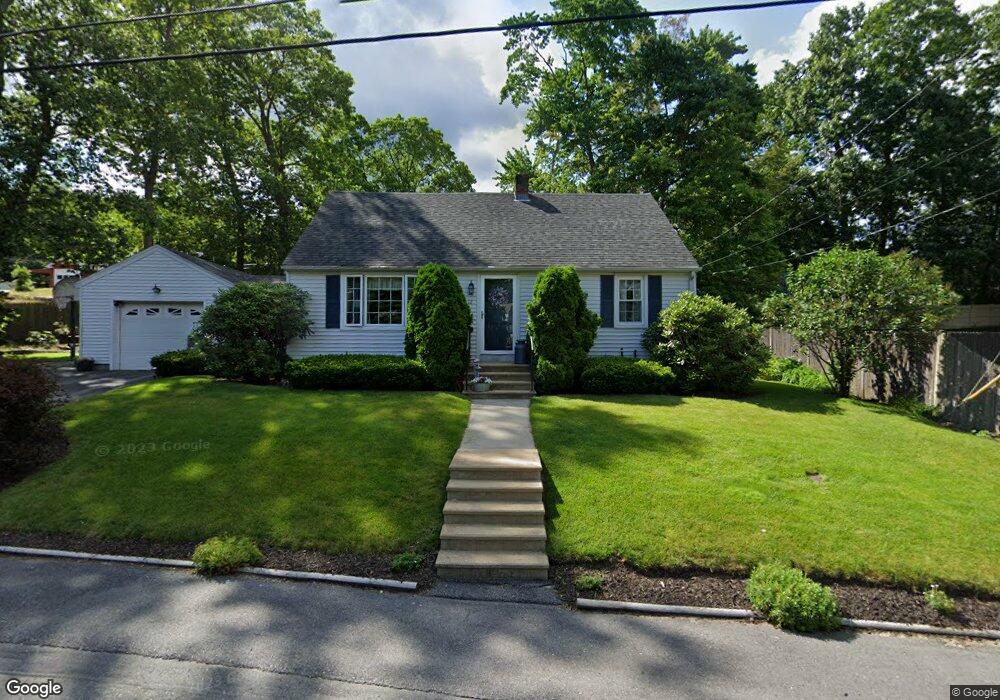
12 Sherwood Rd Auburn, MA 01501
Stoneville NeighborhoodEstimated Value: $496,000 - $520,000
3
Beds
3
Baths
1,477
Sq Ft
$342/Sq Ft
Est. Value
About This Home
This home is located at 12 Sherwood Rd, Auburn, MA 01501 and is currently estimated at $504,503, approximately $341 per square foot. 12 Sherwood Rd is a home located in Worcester County with nearby schools including Auburn Senior High School, Canterbury Street School, and Shrewsbury Montessori School - Auburn Campus.
Ownership History
Date
Name
Owned For
Owner Type
Purchase Details
Closed on
Aug 6, 2025
Sold by
Oleary Paul S and Oleary Maureen E
Bought by
Oleary Ft and Feeley
Current Estimated Value
Purchase Details
Closed on
Feb 19, 1963
Bought by
Oleary Paul S
Create a Home Valuation Report for This Property
The Home Valuation Report is an in-depth analysis detailing your home's value as well as a comparison with similar homes in the area
Home Values in the Area
Average Home Value in this Area
Purchase History
| Date | Buyer | Sale Price | Title Company |
|---|---|---|---|
| Oleary Ft | -- | -- | |
| Oleary Ft | -- | -- | |
| Oleary Paul S | -- | -- |
Source: Public Records
Mortgage History
| Date | Status | Borrower | Loan Amount |
|---|---|---|---|
| Previous Owner | Oleary Paul S | $40,000 | |
| Previous Owner | Oleary Paul S | $25,000 | |
| Previous Owner | Oleary Paul S | $40,000 |
Source: Public Records
Tax History Compared to Growth
Tax History
| Year | Tax Paid | Tax Assessment Tax Assessment Total Assessment is a certain percentage of the fair market value that is determined by local assessors to be the total taxable value of land and additions on the property. | Land | Improvement |
|---|---|---|---|---|
| 2025 | $5,800 | $405,900 | $125,800 | $280,100 |
| 2024 | $5,687 | $380,900 | $119,600 | $261,300 |
| 2023 | $5,601 | $352,700 | $108,700 | $244,000 |
| 2022 | $5,229 | $310,900 | $108,700 | $202,200 |
| 2021 | $9,018 | $269,300 | $95,900 | $173,400 |
| 2020 | $10,857 | $262,700 | $95,900 | $166,800 |
| 2019 | $4,553 | $247,200 | $94,900 | $152,300 |
| 2018 | $4,514 | $234,200 | $88,700 | $145,500 |
| 2017 | $4,059 | $221,300 | $80,500 | $140,800 |
| 2016 | $3,938 | $217,700 | $84,600 | $133,100 |
| 2015 | $3,618 | $209,600 | $84,600 | $125,000 |
| 2014 | $3,539 | $204,700 | $80,500 | $124,200 |
Source: Public Records
Map
Nearby Homes