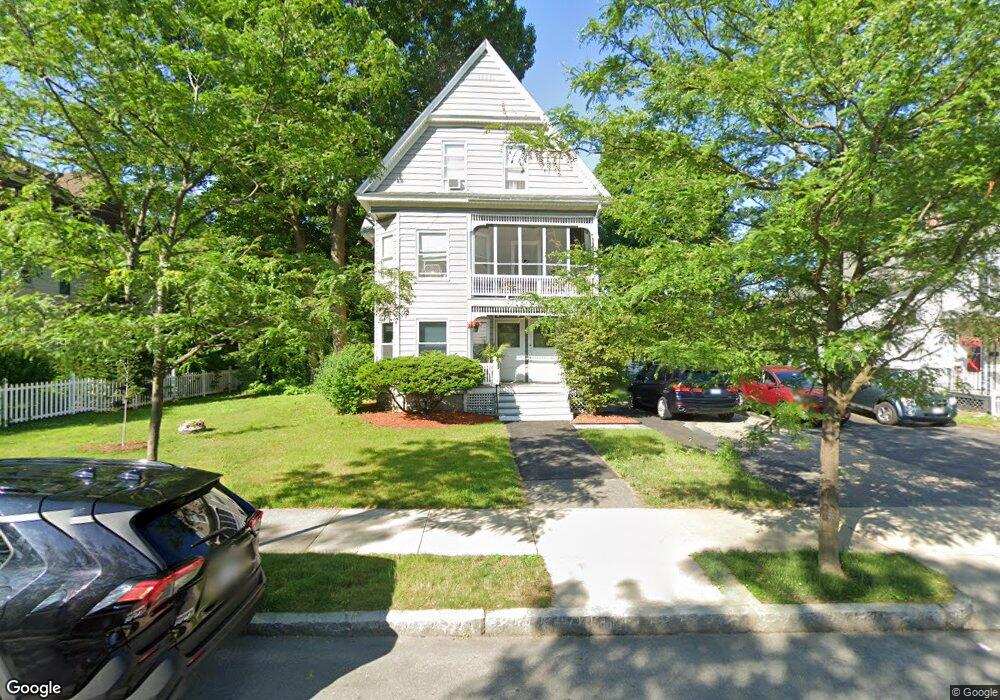
12 Shirley St Worcester, MA 01610
University Park NeighborhoodEstimated Value: $507,730 - $746,000
9
Beds
3
Baths
4,142
Sq Ft
$155/Sq Ft
Est. Value
About This Home
This home is located at 12 Shirley St, Worcester, MA 01610 and is currently estimated at $643,183, approximately $155 per square foot. 12 Shirley St is a home located in Worcester County with nearby schools including Columbus Park Preparatory Academy, Jacob Hiatt Magnet School, and Chandler Magnet.
Ownership History
Date
Name
Owned For
Owner Type
Purchase Details
Closed on
Nov 5, 2021
Sold by
Main South Cmnty Dev Corp
Bought by
Jean Yary
Current Estimated Value
Home Financials for this Owner
Home Financials are based on the most recent Mortgage that was taken out on this home.
Original Mortgage
$392,755
Outstanding Balance
$359,339
Interest Rate
2.88%
Mortgage Type
FHA
Estimated Equity
$283,844
Purchase Details
Closed on
Oct 7, 2019
Sold by
Olson Judith A
Bought by
Main South Community Dev
Purchase Details
Closed on
Dec 10, 1998
Sold by
Olson Donald F and Olson Judith A
Bought by
Main S Community Dev
Home Financials for this Owner
Home Financials are based on the most recent Mortgage that was taken out on this home.
Original Mortgage
$90,000
Interest Rate
6.68%
Create a Home Valuation Report for This Property
The Home Valuation Report is an in-depth analysis detailing your home's value as well as a comparison with similar homes in the area
Home Values in the Area
Average Home Value in this Area
Purchase History
| Date | Buyer | Sale Price | Title Company |
|---|---|---|---|
| Jean Yary | $400,000 | None Available | |
| Main South Community Dev | -- | -- | |
| Main S Community Dev | $105,000 | -- |
Source: Public Records
Mortgage History
| Date | Status | Borrower | Loan Amount |
|---|---|---|---|
| Open | Jean Yary | $392,755 | |
| Previous Owner | Main S Community Dev | $90,000 | |
| Previous Owner | Main S Community Dev | $102,000 |
Source: Public Records
Tax History Compared to Growth
Tax History
| Year | Tax Paid | Tax Assessment Tax Assessment Total Assessment is a certain percentage of the fair market value that is determined by local assessors to be the total taxable value of land and additions on the property. | Land | Improvement |
|---|---|---|---|---|
| 2025 | $7,967 | $604,000 | $98,600 | $505,400 |
| 2024 | $7,385 | $537,100 | $98,600 | $438,500 |
| 2023 | $7,080 | $493,700 | $85,800 | $407,900 |
| 2022 | $6,189 | $406,900 | $68,600 | $338,300 |
| 2021 | $5,721 | $351,400 | $54,900 | $296,500 |
| 2020 | $4,762 | $280,100 | $54,500 | $225,600 |
| 2019 | $4,747 | $263,700 | $47,700 | $216,000 |
| 2018 | $4,665 | $246,700 | $47,700 | $199,000 |
| 2017 | $4,405 | $229,200 | $47,700 | $181,500 |
| 2016 | $4,196 | $203,600 | $34,200 | $169,400 |
| 2015 | $4,086 | $203,600 | $34,200 | $169,400 |
| 2014 | $3,978 | $203,600 | $34,200 | $169,400 |
Source: Public Records
Map
Nearby Homes