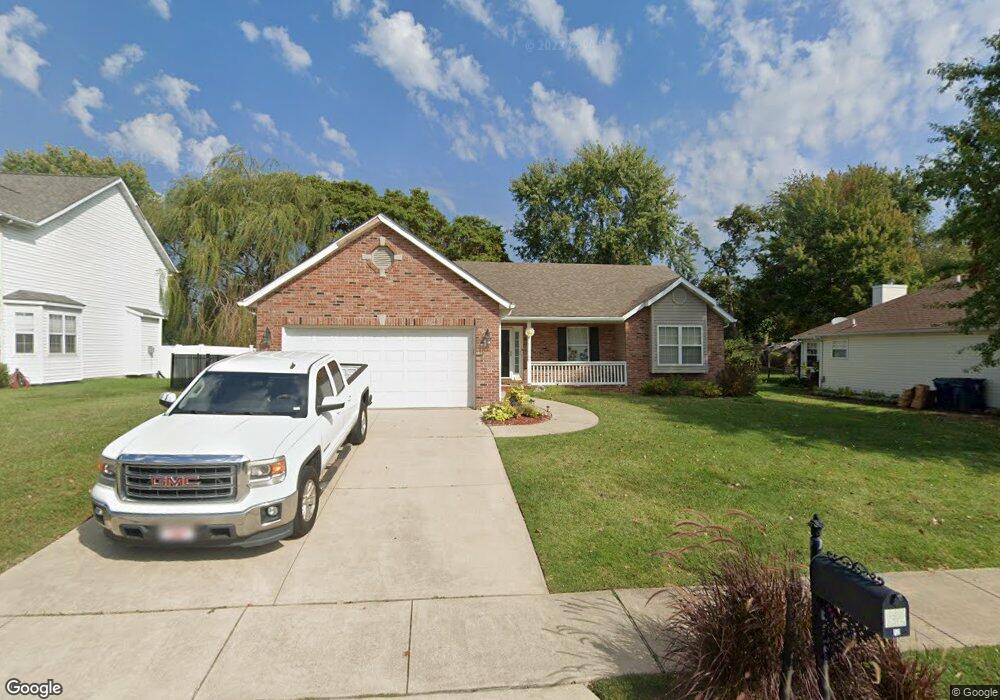
12 Somerset Place Collinsville, IL 62234
Estimated Value: $315,000 - $349,000
3
Beds
2
Baths
1,765
Sq Ft
$189/Sq Ft
Est. Value
About This Home
This home is located at 12 Somerset Place, Collinsville, IL 62234 and is currently estimated at $333,111, approximately $188 per square foot. 12 Somerset Place is a home located in Madison County with nearby schools including John A Renfro Elementary School, Dorris Intermediate School, and Collinsville Middle School.
Ownership History
Date
Name
Owned For
Owner Type
Purchase Details
Closed on
Oct 2, 2019
Sold by
Walling Darrell and Walling Toni
Bought by
Shewmaker Linda M
Current Estimated Value
Purchase Details
Closed on
Oct 17, 2014
Sold by
Murray Gary W
Bought by
Walling Darrell and Walling Toni
Home Financials for this Owner
Home Financials are based on the most recent Mortgage that was taken out on this home.
Original Mortgage
$137,000
Interest Rate
3.95%
Mortgage Type
Purchase Money Mortgage
Purchase Details
Closed on
Dec 10, 2012
Sold by
Lorton Paul L and Lorton Marie E
Bought by
Murray Gary W
Purchase Details
Closed on
Aug 30, 2011
Sold by
Granda Donna K
Bought by
Lorton Paul L and Marie Lorton E
Purchase Details
Closed on
Feb 21, 2004
Sold by
Granda Diane
Bought by
Granda Diane
Create a Home Valuation Report for This Property
The Home Valuation Report is an in-depth analysis detailing your home's value as well as a comparison with similar homes in the area
Home Values in the Area
Average Home Value in this Area
Purchase History
| Date | Buyer | Sale Price | Title Company |
|---|---|---|---|
| Shewmaker Linda M | $200,000 | Abstracts & Titles | |
| Walling Darrell | $167,000 | Southern Illinois Real Estat | |
| Murray Gary W | $173,600 | Abst And Title Inc | |
| Lorton Paul L | $185,000 | Abstracts & Titles Inc | |
| Granda Diane | -- | -- |
Source: Public Records
Mortgage History
| Date | Status | Borrower | Loan Amount |
|---|---|---|---|
| Previous Owner | Walling Darrell | $137,000 |
Source: Public Records
Tax History Compared to Growth
Tax History
| Year | Tax Paid | Tax Assessment Tax Assessment Total Assessment is a certain percentage of the fair market value that is determined by local assessors to be the total taxable value of land and additions on the property. | Land | Improvement |
|---|---|---|---|---|
| 2024 | $5,735 | $95,700 | $20,140 | $75,560 |
| 2023 | $5,735 | $87,190 | $18,330 | $68,860 |
| 2022 | $5,343 | $80,630 | $16,950 | $63,680 |
| 2021 | $4,818 | $75,750 | $15,920 | $59,830 |
| 2020 | $4,626 | $72,270 | $15,190 | $57,080 |
| 2019 | $3,696 | $63,530 | $15,110 | $48,420 |
| 2018 | $3,589 | $60,180 | $14,310 | $45,870 |
| 2017 | $3,577 | $58,990 | $14,030 | $44,960 |
| 2016 | $4,141 | $58,990 | $14,030 | $44,960 |
| 2015 | $3,478 | $57,460 | $13,670 | $43,790 |
| 2014 | $3,478 | $57,460 | $13,670 | $43,790 |
| 2013 | $3,478 | $57,460 | $13,670 | $43,790 |
Source: Public Records
Map
Nearby Homes
- 4 Delta Dr
- 22 Brookwood Dr
- 5 Brookwood Dr
- 1224 Cedar Ridge Ct
- 1446 N Keebler Ave
- 0 N Keebler Ave
- 308 Brown Ave
- 203 Greenfield Dr
- 10 White Lily Dr
- 1120 Williams St
- 1121 Carraway Ct
- 123 Elliot St
- 0 Strong Ave
- 617 N Morrison Ave
- 1210 Constance St
- 123 W Wickliffe Ave
- 2007 Belt Line Rd
- 1059 Lafayette Ct Unit A
- 1051 Lafayette Ct Unit A
- 1006 Vandalia St
- 10 Somerset Place
- 14 Somerset Place
- 8 Somerset Place
- 16 Somerset Place
- 11 Somerset Place
- 9 Somerset Place
- 13 Somerset Place
- 6 Delta Dr
- 6 Somerset Place
- 5 Addison St
- 7 Somerset Place
- 2 Delta Dr
- 125 Amanda St
- 5 Somerset Place
- 7 Addison St
- 4 Somerset Place
- 18 Somerset Place
- 8 Delta Dr
- 20 Grandbrook Blvd
- 22 Grandbrook Blvd