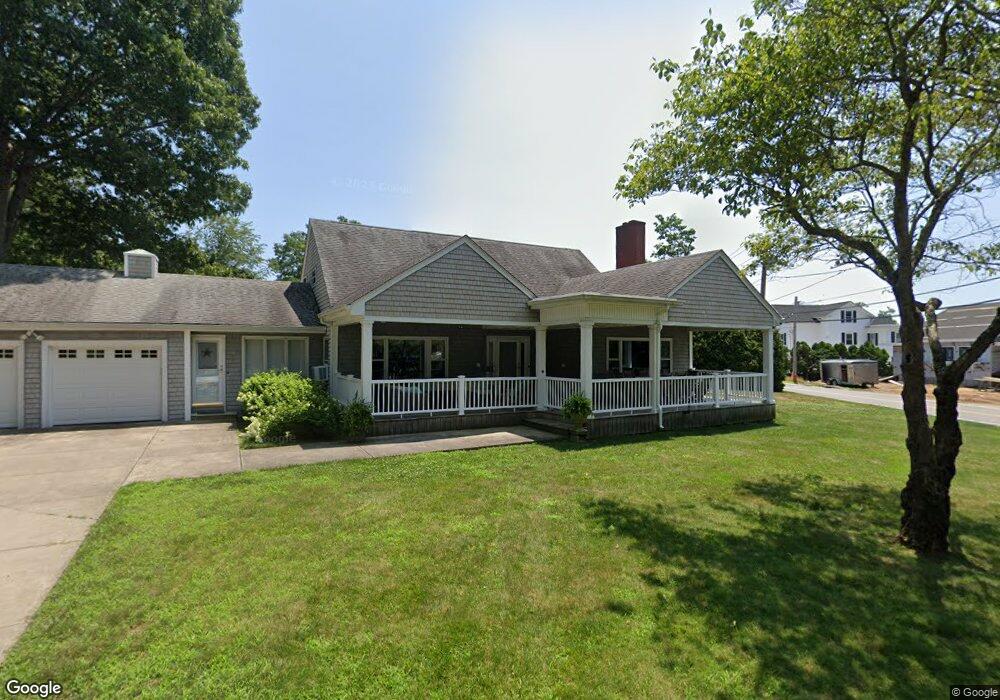
12 South Ln Barrington, RI 02806
Hampden Meadows NeighborhoodEstimated Value: $802,000 - $930,000
3
Beds
2
Baths
2,328
Sq Ft
$368/Sq Ft
Est. Value
About This Home
This home is located at 12 South Ln, Barrington, RI 02806 and is currently estimated at $856,138, approximately $367 per square foot. 12 South Ln is a home located in Bristol County with nearby schools including Barrington High School, Barrington Christian Academy, and East Bay Career Academy.
Ownership History
Date
Name
Owned For
Owner Type
Purchase Details
Closed on
Dec 6, 2024
Sold by
Fellela Ronnie T
Bought by
Ronnie T Fellela Ret and Fellela
Current Estimated Value
Purchase Details
Closed on
Jan 15, 1998
Sold by
Kass Geraldine Natalie
Bought by
Fellela Ronnie T and Fellela Carmela
Home Financials for this Owner
Home Financials are based on the most recent Mortgage that was taken out on this home.
Original Mortgage
$156,800
Interest Rate
7.08%
Create a Home Valuation Report for This Property
The Home Valuation Report is an in-depth analysis detailing your home's value as well as a comparison with similar homes in the area
Home Values in the Area
Average Home Value in this Area
Purchase History
| Date | Buyer | Sale Price | Title Company |
|---|---|---|---|
| Ronnie T Fellela Ret | -- | None Available | |
| Ronnie T Fellela Ret | -- | None Available | |
| Fellela Ronnie T | $196,000 | -- | |
| Fellela Ronnie T | $196,000 | -- |
Source: Public Records
Mortgage History
| Date | Status | Borrower | Loan Amount |
|---|---|---|---|
| Previous Owner | Fellela Ronnie T | $284,000 | |
| Previous Owner | Fellela Ronnie T | $266,000 | |
| Previous Owner | Fellela Ronnie T | $193,500 | |
| Previous Owner | Fellela Ronnie T | $156,800 |
Source: Public Records
Tax History Compared to Growth
Tax History
| Year | Tax Paid | Tax Assessment Tax Assessment Total Assessment is a certain percentage of the fair market value that is determined by local assessors to be the total taxable value of land and additions on the property. | Land | Improvement |
|---|---|---|---|---|
| 2025 | $9,081 | $592,000 | $233,000 | $359,000 |
| 2024 | $8,732 | $592,000 | $233,000 | $359,000 |
| 2023 | $8,851 | $436,000 | $148,000 | $288,000 |
| 2022 | $8,567 | $436,000 | $148,000 | $288,000 |
| 2021 | $8,349 | $436,000 | $148,000 | $288,000 |
| 2020 | $8,172 | $391,000 | $129,000 | $262,000 |
| 2019 | $7,859 | $391,000 | $129,000 | $262,000 |
| 2018 | $7,625 | $391,000 | $129,000 | $262,000 |
| 2017 | $7,194 | $359,700 | $127,300 | $232,400 |
| 2016 | $6,636 | $359,700 | $127,300 | $232,400 |
| 2015 | $6,565 | $359,700 | $127,300 | $232,400 |
| 2014 | $6,196 | $338,600 | $127,500 | $211,100 |
Source: Public Records
Map
Nearby Homes