Estimated Value: $259,000 - $307,000
--
Bed
1
Bath
2,282
Sq Ft
$124/Sq Ft
Est. Value
About This Home
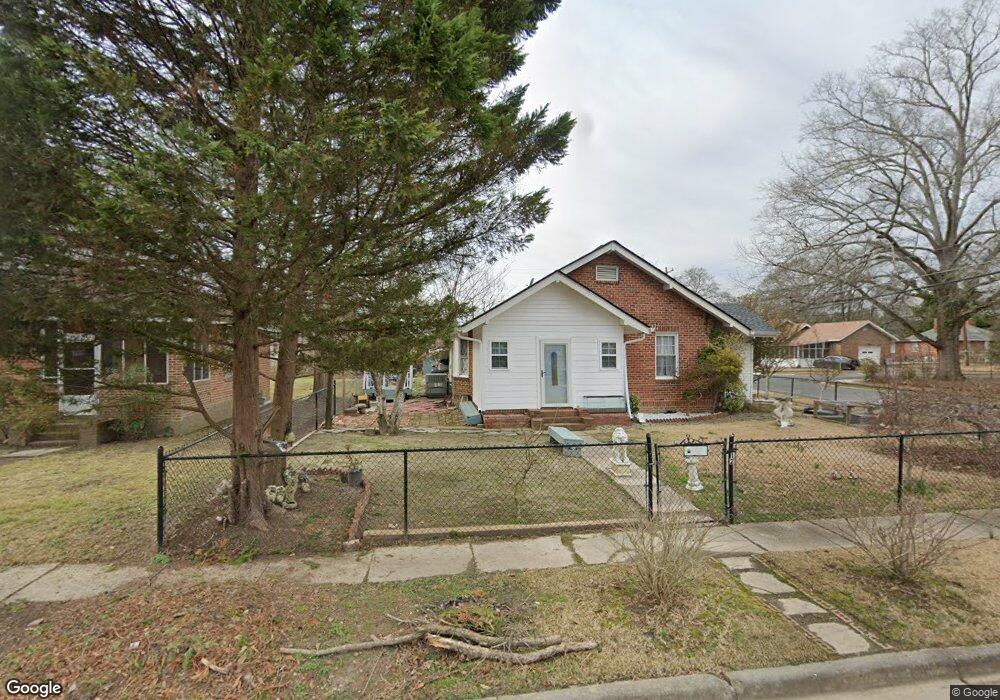
This home is located at 12 Spruce St NE, Rome, GA 30161 and is currently estimated at $283,764, approximately $124 per square foot. 12 Spruce St NE is a home located in Floyd County with nearby schools including Model Middle School, Model High School, and Unity Christian School.
Ownership History
Date
Name
Owned For
Owner Type
Purchase Details
Closed on
Jul 16, 2021
Sold by
Jkl Investments Llc
Bought by
Miranda Ruben and Gonzales Marina
Current Estimated Value
Purchase Details
Closed on
Nov 25, 2013
Sold by
Miranda Ruben
Bought by
Jkl Investments Llc
Home Financials for this Owner
Home Financials are based on the most recent Mortgage that was taken out on this home.
Original Mortgage
$15,000
Interest Rate
4.16%
Mortgage Type
New Conventional
Purchase Details
Closed on
Jul 9, 1999
Sold by
Miranda Ruben
Bought by
Miranda Ruben and Marina Gonzales
Purchase Details
Closed on
Jun 8, 1999
Sold by
Stanfield Stanfield R and Stanfield Mabel
Bought by
Miranda Ruben
Purchase Details
Closed on
Jul 23, 1979
Sold by
Cole Doshie
Bought by
Stanfield Stanfield R and Stanfield Mabel
Purchase Details
Closed on
Sep 26, 1978
Sold by
Berry William C
Bought by
Cole Doshie
Purchase Details
Closed on
Jan 1, 1901
Bought by
Berry William C
Create a Home Valuation Report for This Property
The Home Valuation Report is an in-depth analysis detailing your home's value as well as a comparison with similar homes in the area
Home Values in the Area
Average Home Value in this Area
Purchase History
| Date | Buyer | Sale Price | Title Company |
|---|---|---|---|
| Miranda Ruben | -- | -- | |
| Jkl Investments Llc | $13,061 | -- | |
| Miranda Ruben | -- | -- | |
| Miranda Ruben | $83,500 | -- | |
| Stanfield Stanfield R | $18,500 | -- | |
| Cole Doshie | $15,000 | -- | |
| Berry William C | -- | -- |
Source: Public Records
Mortgage History
| Date | Status | Borrower | Loan Amount |
|---|---|---|---|
| Previous Owner | Jkl Investments Llc | $15,000 |
Source: Public Records
Tax History Compared to Growth
Tax History
| Year | Tax Paid | Tax Assessment Tax Assessment Total Assessment is a certain percentage of the fair market value that is determined by local assessors to be the total taxable value of land and additions on the property. | Land | Improvement |
|---|---|---|---|---|
| 2024 | $2,736 | $115,789 | $11,239 | $104,550 |
| 2023 | $1,929 | $67,576 | $10,092 | $57,484 |
| 2022 | $1,617 | $51,708 | $8,257 | $43,451 |
| 2021 | $1,517 | $47,579 | $8,257 | $39,322 |
| 2020 | $1,402 | $43,552 | $6,308 | $37,244 |
| 2019 | $1,279 | $40,196 | $6,308 | $33,888 |
| 2018 | $1,218 | $38,196 | $6,308 | $31,888 |
| 2017 | $1,185 | $37,010 | $6,308 | $30,702 |
| 2016 | $1,199 | $37,000 | $6,680 | $30,320 |
| 2015 | $1,247 | $39,240 | $2,960 | $36,280 |
| 2014 | $1,247 | $39,408 | $2,960 | $36,448 |
Source: Public Records
Map
Nearby Homes
- 23 Oak St NE
- 27 Oak St NE
- 42 Dogwood St NE
- 40 Dogwood St NE
- 1 Fir St NE
- 7 Ash St NE
- 0 Cypress St NE Unit 7494593
- 0 Cypress St NE Unit 10422946
- 0 Euclid Ave Unit 10617853
- 205 Couper St NE
- 311 Reynolds St NE
- 411 Woodward St NE
- 4 N Haven Dr
- 219 North Ave NE
- 541 Reece St NE
- 17 Joplin St NE
- 302 Tolbert St
- 2 Lindberg Dr NE
- 0 Veterans Memorial Hwy NE Unit 10565194
- 0 Veterans Memorial Hwy NE Unit 10503178
- 10 Spruce St NE
- 8 Spruce St NE
- 1 Norwood St NE
- 15 Oak St NE Unit 50
- 15 Oak St NE
- 17 Oak St NE
- 13 Oak St NE
- 1 Juniper St NE
- 6 Spruce St NE
- 19 Oak St NE
- 0 Spruce St NE Unit 7476720
- 0 Spruce St NE Unit 3166196
- 0 Spruce St NE
- 11 Oak St NE
- 0 Juniper St NE Unit 8660693
- 0 Juniper St NE Unit 8958026
- 0 Juniper St NE
- 18 Juniper St NE
- 3 Norwood St NE
- 3 Juniper St NE