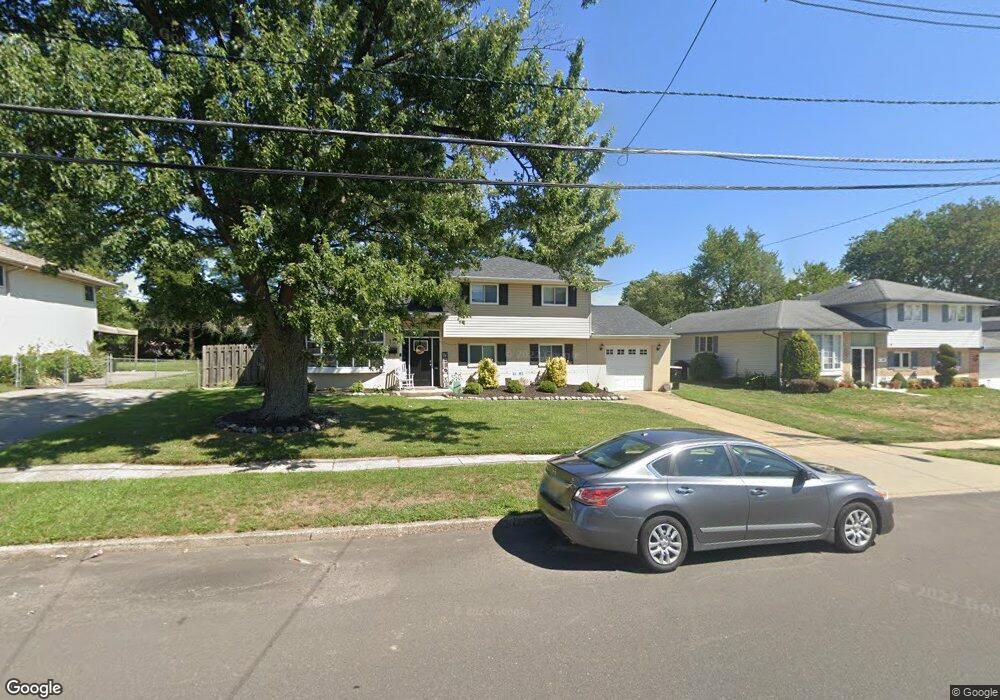
12 Stephen Dr Glendora, NJ 08029
Estimated Value: $363,215 - $400,000
4
Beds
2
Baths
1,509
Sq Ft
$252/Sq Ft
Est. Value
About This Home
This home is located at 12 Stephen Dr, Glendora, NJ 08029 and is currently estimated at $380,554, approximately $252 per square foot. 12 Stephen Dr is a home located in Camden County with nearby schools including Glen Landing Middle School, Triton High School, and St. Teresa Regional School.
Ownership History
Date
Name
Owned For
Owner Type
Purchase Details
Closed on
Oct 16, 2009
Sold by
Berkley Joseph K
Bought by
Bangs Debra and Bangs Joseph
Current Estimated Value
Home Financials for this Owner
Home Financials are based on the most recent Mortgage that was taken out on this home.
Original Mortgage
$194,413
Outstanding Balance
$127,013
Interest Rate
5.09%
Mortgage Type
FHA
Estimated Equity
$253,541
Purchase Details
Closed on
Jun 1, 2004
Sold by
Block Dennis
Bought by
Berkley Joseph K
Home Financials for this Owner
Home Financials are based on the most recent Mortgage that was taken out on this home.
Original Mortgage
$136,800
Interest Rate
6.01%
Create a Home Valuation Report for This Property
The Home Valuation Report is an in-depth analysis detailing your home's value as well as a comparison with similar homes in the area
Home Values in the Area
Average Home Value in this Area
Purchase History
| Date | Buyer | Sale Price | Title Company |
|---|---|---|---|
| Bangs Debra | $198,000 | -- | |
| Berkley Joseph K | $152,000 | -- |
Source: Public Records
Mortgage History
| Date | Status | Borrower | Loan Amount |
|---|---|---|---|
| Open | Bangs Debra | $194,413 | |
| Previous Owner | Berkley Joseph K | $136,800 |
Source: Public Records
Tax History Compared to Growth
Tax History
| Year | Tax Paid | Tax Assessment Tax Assessment Total Assessment is a certain percentage of the fair market value that is determined by local assessors to be the total taxable value of land and additions on the property. | Land | Improvement |
|---|---|---|---|---|
| 2025 | $8,410 | $199,000 | $60,000 | $139,000 |
| 2024 | $8,129 | $199,000 | $60,000 | $139,000 |
| 2023 | $8,129 | $199,000 | $60,000 | $139,000 |
| 2022 | $8,085 | $199,000 | $60,000 | $139,000 |
| 2021 | $7,916 | $199,000 | $60,000 | $139,000 |
| 2020 | $7,922 | $199,000 | $60,000 | $139,000 |
| 2019 | $7,747 | $199,000 | $60,000 | $139,000 |
| 2018 | $7,713 | $199,000 | $60,000 | $139,000 |
| 2017 | $8,987 | $199,000 | $60,000 | $139,000 |
| 2016 | $7,299 | $199,000 | $60,000 | $139,000 |
| 2015 | $6,776 | $199,000 | $60,000 | $139,000 |
| 2014 | $6,736 | $199,000 | $60,000 | $139,000 |
Source: Public Records
Map
Nearby Homes