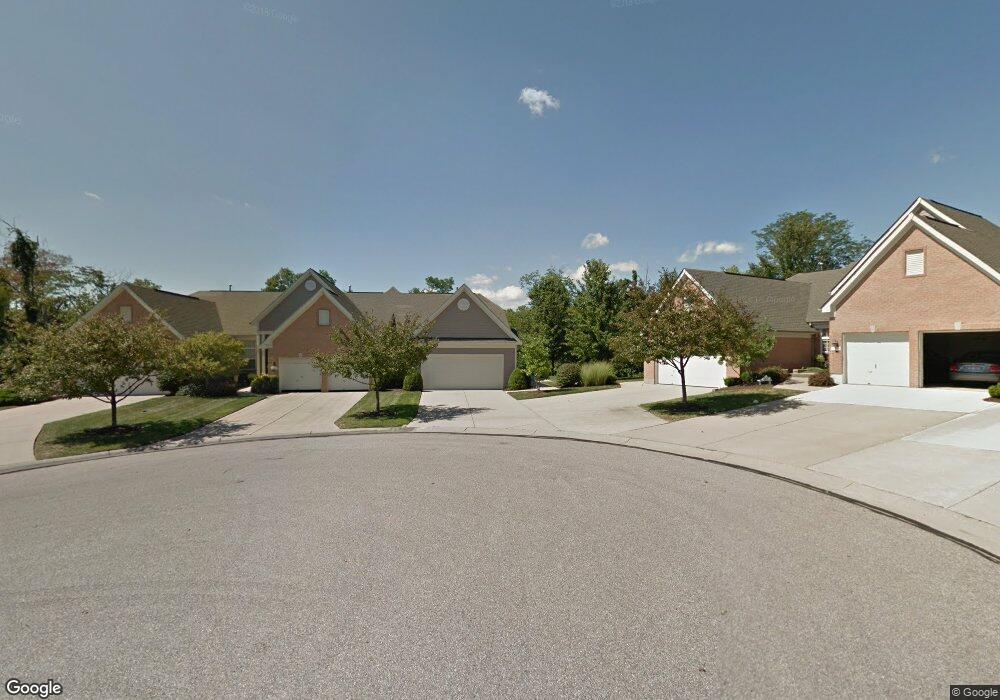
12 Stonehaven Dr Unit 2C North Bend, OH 45052
Estimated Value: $382,000 - $399,000
3
Beds
3
Baths
2,420
Sq Ft
$160/Sq Ft
Est. Value
About This Home
This home is located at 12 Stonehaven Dr Unit 2C, North Bend, OH 45052 and is currently estimated at $388,049, approximately $160 per square foot. 12 Stonehaven Dr Unit 2C is a home located in Hamilton County with nearby schools including Charles T. Young Elementary School, Taylor Middle School, and Taylor High School.
Ownership History
Date
Name
Owned For
Owner Type
Purchase Details
Closed on
Feb 25, 2008
Sold by
Cagney Joyce and Cagney Guy
Bought by
Cagney Joyce
Current Estimated Value
Home Financials for this Owner
Home Financials are based on the most recent Mortgage that was taken out on this home.
Original Mortgage
$142,400
Interest Rate
5.51%
Mortgage Type
New Conventional
Purchase Details
Closed on
Feb 26, 2007
Sold by
Cagney Guy
Bought by
Cagney Joyce
Home Financials for this Owner
Home Financials are based on the most recent Mortgage that was taken out on this home.
Original Mortgage
$150,000
Interest Rate
6.27%
Mortgage Type
Unknown
Purchase Details
Closed on
Feb 23, 2007
Sold by
Wolfe H Nicholas and Wolfe Robert
Bought by
Cagney Guy and Cagney Joyce
Home Financials for this Owner
Home Financials are based on the most recent Mortgage that was taken out on this home.
Original Mortgage
$150,000
Interest Rate
6.27%
Mortgage Type
Unknown
Create a Home Valuation Report for This Property
The Home Valuation Report is an in-depth analysis detailing your home's value as well as a comparison with similar homes in the area
Home Values in the Area
Average Home Value in this Area
Purchase History
| Date | Buyer | Sale Price | Title Company |
|---|---|---|---|
| Cagney Joyce | -- | Attorney | |
| Cagney Joyce | -- | Attorney | |
| Cagney Joyce | -- | Attorney | |
| Cagney Guy | $247,500 | Attorney |
Source: Public Records
Mortgage History
| Date | Status | Borrower | Loan Amount |
|---|---|---|---|
| Closed | Cagney Joyce | $142,400 | |
| Closed | Cagney Guy | $150,000 |
Source: Public Records
Tax History Compared to Growth
Tax History
| Year | Tax Paid | Tax Assessment Tax Assessment Total Assessment is a certain percentage of the fair market value that is determined by local assessors to be the total taxable value of land and additions on the property. | Land | Improvement |
|---|---|---|---|---|
| 2024 | $5,190 | $103,019 | $15,750 | $87,269 |
| 2023 | $5,218 | $103,019 | $15,750 | $87,269 |
| 2022 | $5,701 | $92,460 | $15,400 | $77,060 |
| 2021 | $5,562 | $92,460 | $15,400 | $77,060 |
| 2020 | $5,504 | $92,460 | $15,400 | $77,060 |
| 2019 | $5,202 | $84,053 | $14,000 | $70,053 |
| 2018 | $4,803 | $84,053 | $14,000 | $70,053 |
| 2017 | $4,835 | $84,053 | $14,000 | $70,053 |
| 2016 | $4,832 | $86,136 | $13,108 | $73,028 |
| 2015 | $4,883 | $86,136 | $13,108 | $73,028 |
| 2014 | $4,936 | $86,136 | $13,108 | $73,028 |
| 2013 | $4,635 | $80,500 | $12,250 | $68,250 |
Source: Public Records
Map
Nearby Homes
- 143 Fox Hills Ln
- 115 Fox Hills Ln
- 3503 Chestnut Park Ln
- 3498 Chestnut Park Ln
- 0 Saint Annes Unit 1826785
- 8735 Bridgetown Rd
- 505 Aston View Ln
- 540 Aston View Ln
- 517 E State Rd
- 3623 Hazelnut Ct
- 42 Edinburgh Place Unit 42
- 3661 Chestnut Park Ln
- 339 Sekitan Ave
- 3601 Chadwell Springs Ct
- 3377 Citation Ln
- 8061 Turcotte Ln
- 3889 Bear Ln
- 3129 Triplecrown Dr
- 3813 Beacon Woods Dr
- 3817 Legendary Ridge Ln
- 14 Stonehaven Dr Unit 2B
- 16 Stonehaven Dr Unit 2A
- 8 Stonehaven Dr
- 2 Stonehaven Dr
- 6 Stonehaven Dr
- 26 Stonehaven Dr
- 24 Stonehaven Dr
- 28 Stonehaven Dr Unit 1A
- 22 Stonehaven Dr Unit 1D
- 4 Stonehaven Dr
- 92 Aston Oaks Dr
- 32 Stonehaven Dr Unit 5D
- 38 Stonehaven Dr
- 101 Aston Oaks Dr
- 34 Stonehaven Dr Unit 5C
- 36 Stonehaven Dr Unit 5B
- 30 Aston Oaks Dr
- 99 Aston Oaks Dr
- 42 Stonehaven Dr Unit 7D
- 48 Stonehaven Dr Unit 7A