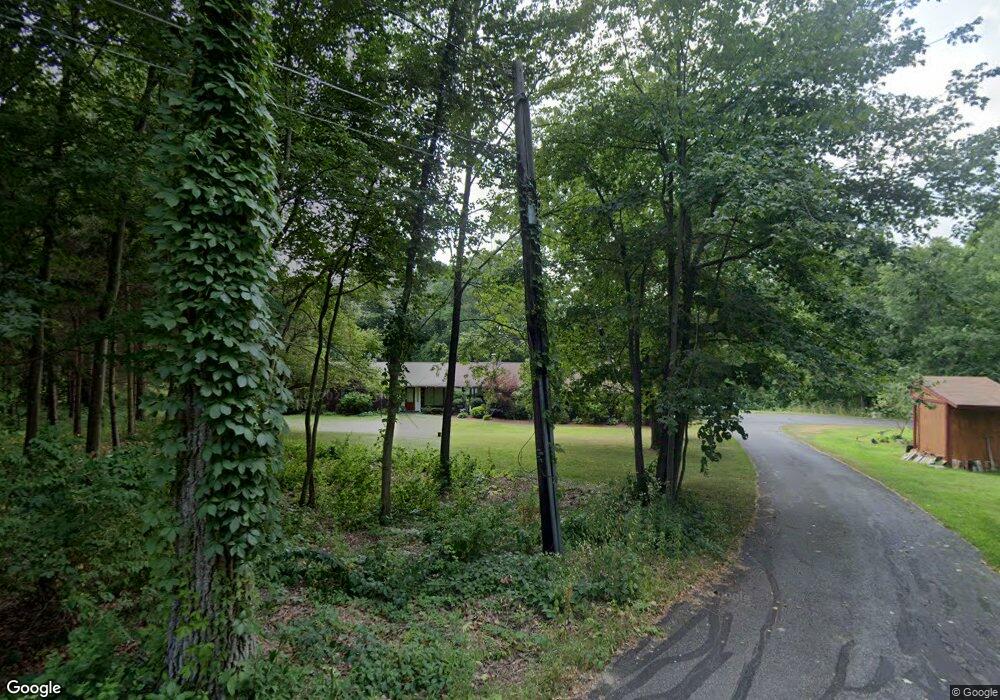
12 Stonewall Dr Grafton, MA 01519
Estimated Value: $857,000 - $1,074,000
4
Beds
3
Baths
2,612
Sq Ft
$357/Sq Ft
Est. Value
About This Home
This home is located at 12 Stonewall Dr, Grafton, MA 01519 and is currently estimated at $933,124, approximately $357 per square foot. 12 Stonewall Dr is a home located in Worcester County with nearby schools including Grafton High School, Silver Spruce Montessori School, and Touchstone Community School.
Ownership History
Date
Name
Owned For
Owner Type
Purchase Details
Closed on
Apr 19, 2022
Sold by
Niver Brett and Eckler Charlotte F
Bought by
Eckler Charlotte F
Current Estimated Value
Home Financials for this Owner
Home Financials are based on the most recent Mortgage that was taken out on this home.
Original Mortgage
$50,000
Outstanding Balance
$43,936
Interest Rate
3.85%
Mortgage Type
Credit Line Revolving
Estimated Equity
$889,189
Purchase Details
Closed on
Jul 30, 2009
Sold by
Steele David C
Bought by
Niver Brett and Eckler Charlotte
Home Financials for this Owner
Home Financials are based on the most recent Mortgage that was taken out on this home.
Original Mortgage
$350,000
Interest Rate
5.43%
Mortgage Type
Purchase Money Mortgage
Purchase Details
Closed on
Aug 16, 1994
Sold by
Rossiter Marion B
Bought by
Steele David C
Create a Home Valuation Report for This Property
The Home Valuation Report is an in-depth analysis detailing your home's value as well as a comparison with similar homes in the area
Home Values in the Area
Average Home Value in this Area
Purchase History
| Date | Buyer | Sale Price | Title Company |
|---|---|---|---|
| Eckler Charlotte F | -- | None Available | |
| Niver Brett | $458,000 | -- | |
| Steele David C | $190,000 | -- | |
| Niver Brett | $458,000 | -- | |
| Steele David C | $190,000 | -- |
Source: Public Records
Mortgage History
| Date | Status | Borrower | Loan Amount |
|---|---|---|---|
| Open | Eckler Charlotte F | $50,000 | |
| Open | Eckler Charlotte F | $282,000 | |
| Previous Owner | Steele David C | $275,000 | |
| Previous Owner | Niver Brett | $350,000 |
Source: Public Records
Tax History Compared to Growth
Tax History
| Year | Tax Paid | Tax Assessment Tax Assessment Total Assessment is a certain percentage of the fair market value that is determined by local assessors to be the total taxable value of land and additions on the property. | Land | Improvement |
|---|---|---|---|---|
| 2025 | $11,506 | $825,400 | $237,100 | $588,300 |
| 2024 | $11,409 | $797,300 | $237,100 | $560,200 |
| 2023 | $10,763 | $685,100 | $237,100 | $448,000 |
| 2022 | $10,184 | $603,300 | $205,100 | $398,200 |
| 2021 | $9,954 | $579,400 | $187,500 | $391,900 |
| 2020 | $9,450 | $572,700 | $187,500 | $385,200 |
| 2019 | $8,662 | $519,900 | $165,900 | $354,000 |
| 2018 | $8,527 | $514,000 | $164,600 | $349,400 |
| 2017 | $8,254 | $503,300 | $153,900 | $349,400 |
| 2016 | $7,884 | $470,700 | $168,800 | $301,900 |
| 2015 | $7,823 | $474,100 | $168,800 | $305,300 |
| 2014 | $6,974 | $457,000 | $177,700 | $279,300 |
Source: Public Records
Map
Nearby Homes