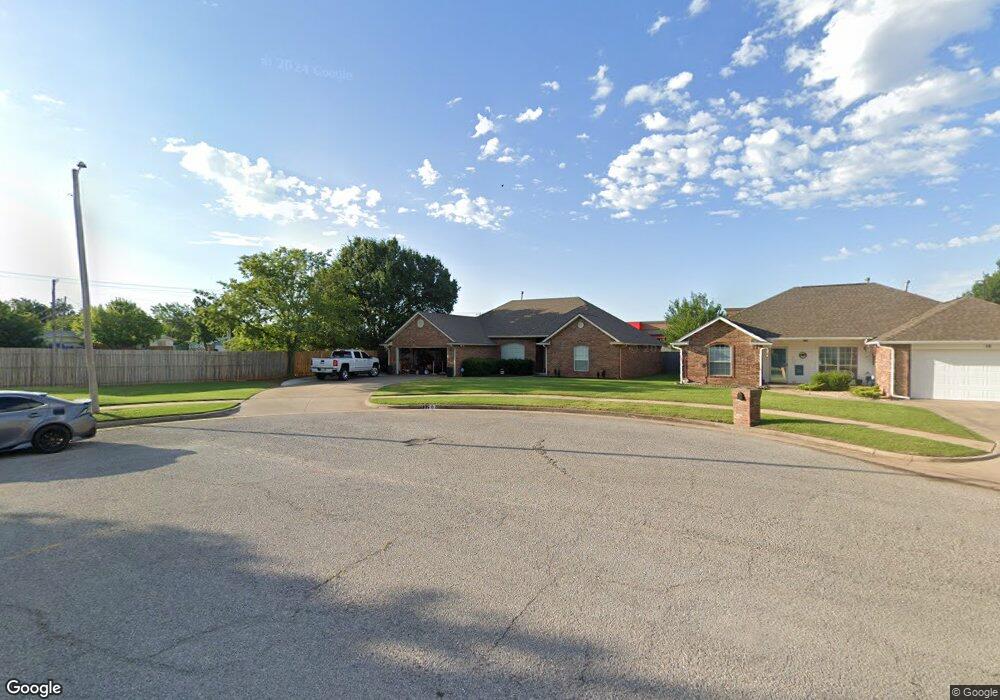
12 SW 103rd St Oklahoma City, OK 73139
Southbrook NeighborhoodEstimated Value: $245,732 - $263,000
3
Beds
2
Baths
1,971
Sq Ft
$129/Sq Ft
Est. Value
About This Home
This home is located at 12 SW 103rd St, Oklahoma City, OK 73139 and is currently estimated at $255,183, approximately $129 per square foot. 12 SW 103rd St is a home located in Cleveland County with nearby schools including Sky Ranch Elementary School, West Junior High School, and Westmoore High School.
Ownership History
Date
Name
Owned For
Owner Type
Purchase Details
Closed on
Dec 31, 2013
Sold by
Osborn Terry Don and Osborn Robbin
Bought by
Osborn True W and Osborn Sherry A
Current Estimated Value
Home Financials for this Owner
Home Financials are based on the most recent Mortgage that was taken out on this home.
Original Mortgage
$126,000
Outstanding Balance
$94,646
Interest Rate
4.26%
Mortgage Type
New Conventional
Estimated Equity
$160,537
Purchase Details
Closed on
Dec 14, 2010
Sold by
Pate Betty L and Pate Linda Ruth
Bought by
Pate and Betty L Pate Revocable Trust
Purchase Details
Closed on
Jan 19, 2005
Sold by
Pate Betty L
Bought by
Pate Betty L and Pate Linda Ruth
Purchase Details
Closed on
Sep 9, 2002
Sold by
Federal Natl Mtg Assoc
Bought by
Pate Pate C and Pate Betty
Purchase Details
Closed on
Aug 8, 2002
Sold by
Baird Tony L and Baird Trena A
Bought by
Federal Natl Mtg Assoc
Create a Home Valuation Report for This Property
The Home Valuation Report is an in-depth analysis detailing your home's value as well as a comparison with similar homes in the area
Home Values in the Area
Average Home Value in this Area
Purchase History
| Date | Buyer | Sale Price | Title Company |
|---|---|---|---|
| Osborn True W | -- | The Oklahoma City Abstract | |
| Pate | -- | None Available | |
| Pate Betty L | -- | None Available | |
| Pate Pate C | $145,000 | -- | |
| Federal Natl Mtg Assoc | -- | -- |
Source: Public Records
Mortgage History
| Date | Status | Borrower | Loan Amount |
|---|---|---|---|
| Open | Osborn True W | $126,000 |
Source: Public Records
Tax History Compared to Growth
Tax History
| Year | Tax Paid | Tax Assessment Tax Assessment Total Assessment is a certain percentage of the fair market value that is determined by local assessors to be the total taxable value of land and additions on the property. | Land | Improvement |
|---|---|---|---|---|
| 2024 | $3,044 | $25,011 | $4,944 | $20,067 |
| 2023 | $2,912 | $23,820 | $4,705 | $19,115 |
| 2022 | $2,810 | $22,685 | $4,371 | $18,314 |
| 2021 | $2,670 | $21,605 | $4,332 | $17,273 |
| 2020 | $2,552 | $20,576 | $4,107 | $16,469 |
| 2019 | $2,459 | $19,597 | $3,000 | $16,597 |
| 2018 | $2,487 | $19,597 | $3,000 | $16,597 |
| 2017 | $2,489 | $19,597 | $0 | $0 |
| 2016 | $2,515 | $19,597 | $3,000 | $16,597 |
| 2015 | $2,222 | $18,733 | $2,839 | $15,894 |
| 2014 | $2,152 | $17,841 | $1,886 | $15,955 |
Source: Public Records
Map
Nearby Homes
- 10308 S Broadway Ave
- 41 SW 102nd St
- 2829 Larkspur Rd
- 5 SW 101st St
- 24 SW 100th St
- 10108 S Ranchwood Manor Dr
- 2605 Queensbury Rd
- 409 SW 102nd St
- 10705 S Harvey Ave
- 912 NW 24th St
- 433 SW 99th St
- 3523 Victorian Dr
- 8 E Ranchwood Dr
- 2404 Piccadilly Cir
- 8 E Ranchwood Cir
- 512 SW 103rd St
- 113 W Ranchwood Ct
- 933 NW 22nd St
- 832 NW 23rd St
- 617 SW 104th Place
- 16 SW 103rd St
- 0 SE 103rd St
- 20 SW 103rd St
- 24 SW 103rd St
- 13 SW 103rd St
- 17 SW 103rd St
- 10400 Lester Ln
- 21 SW 103rd St
- 10404 Lester Ln
- 10408 Lester Ln
- 25 SW 103rd St
- 4 SW 102nd St
- 10309 Lester Ln
- 10305 Lester Ln
- 10412 Lester Ln
- 8 SW 102nd St
- 12 SW 102nd St
- 10401 Lester Ln
- 16 SW 102nd St
- 29 SW 103rd St