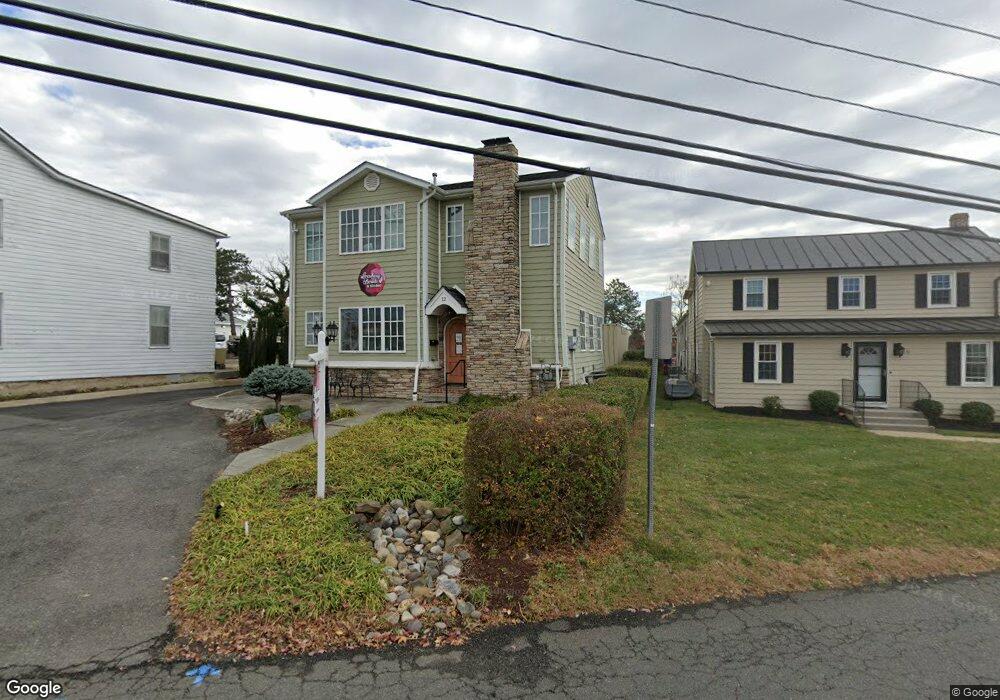
12 Sycolin Rd SE Leesburg, VA 20175
Estimated Value: $440,515
--
Bed
1
Bath
4,272
Sq Ft
$103/Sq Ft
Est. Value
About This Home
This home is located at 12 Sycolin Rd SE, Leesburg, VA 20175 and is currently priced at $440,515, approximately $103 per square foot. 12 Sycolin Rd SE is a home located in Loudoun County with nearby schools including Frederick Douglass Elementary School, J. Lupton Simpson Middle School, and Loudoun County High School.
Ownership History
Date
Name
Owned For
Owner Type
Purchase Details
Closed on
Nov 21, 2008
Sold by
East Oaks Llc
Bought by
12 Sycolin Llc
Current Estimated Value
Home Financials for this Owner
Home Financials are based on the most recent Mortgage that was taken out on this home.
Original Mortgage
$205,000
Outstanding Balance
$134,234
Interest Rate
6.03%
Mortgage Type
New Conventional
Purchase Details
Closed on
Aug 30, 2007
Sold by
Mortgage Trustees Llc
Bought by
East Oaks Llc
Purchase Details
Closed on
Aug 26, 2002
Sold by
Smith Stephen
Bought by
Terrebonne Brian
Home Financials for this Owner
Home Financials are based on the most recent Mortgage that was taken out on this home.
Original Mortgage
$238,000
Interest Rate
6.55%
Purchase Details
Closed on
Oct 16, 2001
Sold by
Thornton Henry David
Bought by
Terrebonne Brian J
Home Financials for this Owner
Home Financials are based on the most recent Mortgage that was taken out on this home.
Original Mortgage
$140,100
Interest Rate
6.77%
Create a Home Valuation Report for This Property
The Home Valuation Report is an in-depth analysis detailing your home's value as well as a comparison with similar homes in the area
Home Values in the Area
Average Home Value in this Area
Purchase History
| Date | Buyer | Sale Price | Title Company |
|---|---|---|---|
| 12 Sycolin Llc | $225,000 | -- | |
| East Oaks Llc | $265,900 | -- | |
| Terrebonne Brian | $280,000 | -- | |
| Terrebonne Brian J | $147,500 | -- |
Source: Public Records
Mortgage History
| Date | Status | Borrower | Loan Amount |
|---|---|---|---|
| Open | 12 Sycolin Llc | $205,000 | |
| Previous Owner | Terrebonne Brian | $238,000 | |
| Previous Owner | Terrebonne Brian J | $140,100 |
Source: Public Records
Tax History Compared to Growth
Tax History
| Year | Tax Paid | Tax Assessment Tax Assessment Total Assessment is a certain percentage of the fair market value that is determined by local assessors to be the total taxable value of land and additions on the property. | Land | Improvement |
|---|---|---|---|---|
| 2025 | $3,348 | $415,940 | $172,500 | $243,440 |
| 2024 | $3,512 | $406,020 | $172,500 | $233,520 |
| 2023 | $3,725 | $425,660 | $172,500 | $253,160 |
| 2022 | $3,644 | $409,480 | $172,500 | $236,980 |
| 2021 | $3,833 | $391,120 | $180,300 | $210,820 |
| 2020 | $4,079 | $394,070 | $180,300 | $213,770 |
| 2019 | $4,202 | $402,060 | $180,300 | $221,760 |
| 2018 | $4,447 | $409,890 | $180,300 | $229,590 |
| 2017 | $4,611 | $409,890 | $180,300 | $229,590 |
| 2016 | $4,693 | $409,890 | $0 | $0 |
| 2015 | $736 | $221,930 | $0 | $221,930 |
| 2014 | $507 | $96,650 | $0 | $96,650 |
Source: Public Records
Map
Nearby Homes
- 118 Fort Evans Rd SE Unit C
- BIRKHALL Plan at Brickyard
- HIGHGROVE Plan at Brickyard
- BALMORAL Plan at Brickyard
- 101 Fort Evans Rd SE Unit F
- 135 Oak View Dr SE
- 589 Rockbridge Dr SE
- 265 High Rail Terrace SE
- 214 Shenandoah St SE
- 421 Bicksler Square SE
- 411 Bicksler Square SE
- 459 Kornblau Terrace SE
- 202 Murdoch Square SE
- 608 Blue Ridge Ave NE
- 678 Gateway Dr SE Unit 907
- 224 Prince St NE
- 664 Gateway Dr SE Unit 314
- 251 Meadows Ln NE
- 414 Madison Ct SE
- 5 Stationmaster St SE Unit 202
- 18 Sycolin Rd SE
- 10 Sycolin Rd SE
- 505 E Market St
- 509 E Market St
- 515 E Market St
- 521 E Market St Unit A OR B
- 521 E Market St
- 407 E Market St
- 23 Sycolin Rd SE
- 508 E Market St
- 27 Sycolin Rd SE
- 29 Sycolin Rd SE
- 526 E Market St
- 504 E Market St
- 502 E Market St
- 33 Sycolin Rd SE
- 401 E Market St
- 219 Catoctin Cir SE
- 40 Sycolin Rd SE
- 404 E Market St