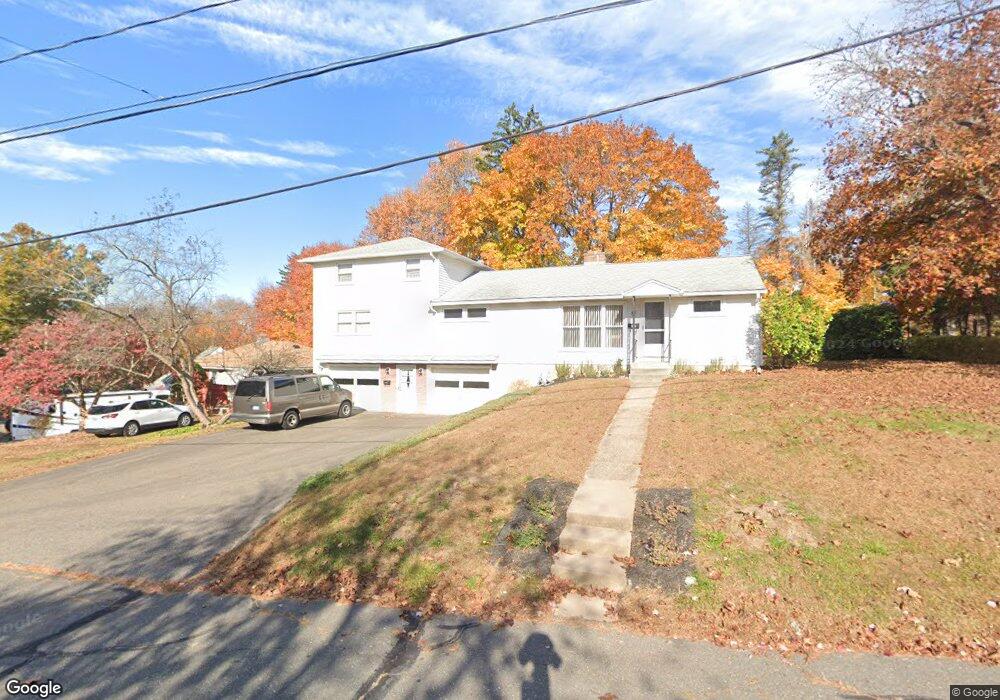
12 Sylvan Ave Terryville, CT 06786
Estimated Value: $293,000 - $375,638
5
Beds
2
Baths
2,184
Sq Ft
$151/Sq Ft
Est. Value
About This Home
This home is located at 12 Sylvan Ave, Terryville, CT 06786 and is currently estimated at $329,160, approximately $150 per square foot. 12 Sylvan Ave is a home located in Litchfield County with nearby schools including Harry S. Fisher Elementary School, Eli Terry Jr. Middle School, and Terryville High School.
Ownership History
Date
Name
Owned For
Owner Type
Purchase Details
Closed on
Jun 26, 2024
Sold by
Santopietro Lorraine and Fusco Mary
Bought by
Santopietro Alissa M
Current Estimated Value
Home Financials for this Owner
Home Financials are based on the most recent Mortgage that was taken out on this home.
Original Mortgage
$200,000
Outstanding Balance
$197,625
Interest Rate
7.02%
Mortgage Type
Purchase Money Mortgage
Estimated Equity
$131,535
Create a Home Valuation Report for This Property
The Home Valuation Report is an in-depth analysis detailing your home's value as well as a comparison with similar homes in the area
Home Values in the Area
Average Home Value in this Area
Purchase History
| Date | Buyer | Sale Price | Title Company |
|---|---|---|---|
| Santopietro Alissa M | $270,000 | None Available | |
| Santopietro Alissa M | $270,000 | None Available |
Source: Public Records
Mortgage History
| Date | Status | Borrower | Loan Amount |
|---|---|---|---|
| Open | Santopietro Alissa M | $200,000 | |
| Closed | Santopietro Alissa M | $200,000 |
Source: Public Records
Tax History Compared to Growth
Tax History
| Year | Tax Paid | Tax Assessment Tax Assessment Total Assessment is a certain percentage of the fair market value that is determined by local assessors to be the total taxable value of land and additions on the property. | Land | Improvement |
|---|---|---|---|---|
| 2025 | $6,130 | $154,910 | $42,770 | $112,140 |
| 2024 | $5,986 | $154,910 | $42,770 | $112,140 |
| 2023 | $5,840 | $154,910 | $42,770 | $112,140 |
| 2022 | $5,626 | $154,910 | $42,770 | $112,140 |
| 2021 | $4,626 | $113,862 | $43,400 | $70,462 |
| 2020 | $4,626 | $113,862 | $43,400 | $70,462 |
| 2019 | $4,626 | $113,862 | $43,400 | $70,462 |
| 2016 | $4,522 | $125,545 | $43,400 | $82,145 |
| 2015 | $4,448 | $125,545 | $43,400 | $82,145 |
| 2014 | $4,375 | $125,545 | $43,400 | $82,145 |
Source: Public Records
Map
Nearby Homes