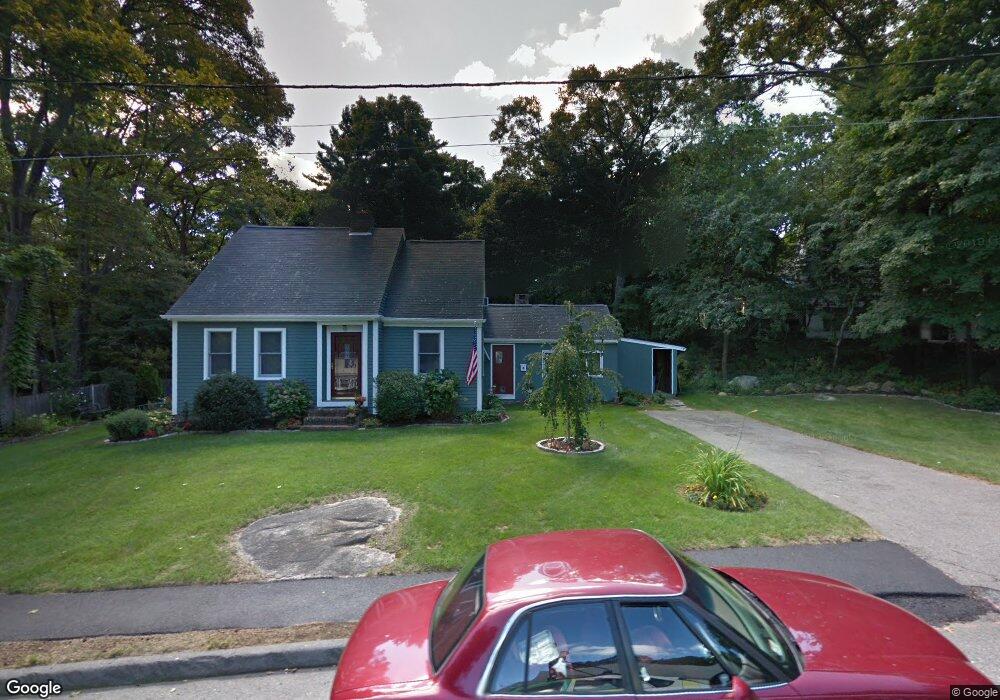
12 Sylvan Cir Lynnfield, MA 01940
Estimated Value: $804,164 - $863,000
3
Beds
2
Baths
2,172
Sq Ft
$386/Sq Ft
Est. Value
About This Home
This home is located at 12 Sylvan Cir, Lynnfield, MA 01940 and is currently estimated at $838,291, approximately $385 per square foot. 12 Sylvan Cir is a home located in Essex County with nearby schools including Lynnfield Middle School, Lynnfield High School, and Our Lady Of Assumption School.
Ownership History
Date
Name
Owned For
Owner Type
Purchase Details
Closed on
May 8, 2020
Sold by
Casey Richard R and Casey Havener
Bought by
R R & J Havener Caset Lt
Current Estimated Value
Home Financials for this Owner
Home Financials are based on the most recent Mortgage that was taken out on this home.
Original Mortgage
$230,000
Outstanding Balance
$202,917
Interest Rate
3.3%
Mortgage Type
New Conventional
Estimated Equity
$635,374
Purchase Details
Closed on
May 7, 2020
Sold by
R R & J Havener Casey Lt
Bought by
Casey Richard R and Casey Havener
Home Financials for this Owner
Home Financials are based on the most recent Mortgage that was taken out on this home.
Original Mortgage
$230,000
Outstanding Balance
$202,917
Interest Rate
3.3%
Mortgage Type
New Conventional
Estimated Equity
$635,374
Purchase Details
Closed on
Nov 7, 2019
Sold by
Casey Richard R and Casey Havener
Bought by
Richard R & J V Casey Lt
Create a Home Valuation Report for This Property
The Home Valuation Report is an in-depth analysis detailing your home's value as well as a comparison with similar homes in the area
Home Values in the Area
Average Home Value in this Area
Purchase History
| Date | Buyer | Sale Price | Title Company |
|---|---|---|---|
| R R & J Havener Caset Lt | -- | None Available | |
| Casey Richard R | -- | None Available | |
| Richard R & J V Casey Lt | -- | -- |
Source: Public Records
Mortgage History
| Date | Status | Borrower | Loan Amount |
|---|---|---|---|
| Open | Casey Richard R | $230,000 |
Source: Public Records
Tax History
| Year | Tax Paid | Tax Assessment Tax Assessment Total Assessment is a certain percentage of the fair market value that is determined by local assessors to be the total taxable value of land and additions on the property. | Land | Improvement |
|---|---|---|---|---|
| 2025 | $8,127 | $769,600 | $484,300 | $285,300 |
| 2024 | $7,162 | $681,400 | $428,600 | $252,800 |
| 2023 | $7,172 | $634,700 | $406,600 | $228,100 |
| 2022 | $7,249 | $604,600 | $406,600 | $198,000 |
| 2021 | $7,395 | $557,300 | $372,700 | $184,600 |
| 2020 | $7,215 | $518,300 | $333,700 | $184,600 |
| 2019 | $7,210 | $518,300 | $333,700 | $184,600 |
| 2018 | $7,030 | $510,900 | $333,700 | $177,200 |
| 2017 | $6,878 | $499,100 | $321,900 | $177,200 |
| 2016 | $6,574 | $453,400 | $276,100 | $177,300 |
| 2015 | $6,555 | $452,400 | $275,100 | $177,300 |
Source: Public Records
Map
Nearby Homes
- 60r Lynnbrook Rd
- 37 Locust St
- 741 Salem St
- 344 Broadway
- 695 Salem St
- 1100 Salem St Unit 58
- 1200 Salem St Unit 190
- 1200 Salem St Unit 151
- 12 Mansfield St
- 527 Salem St Unit 42
- 115 Quinn Rd
- 233 Bartholomew St
- 9 Broadway Unit 210
- 16 Sarah's Way
- 325 Den Quarry Rd
- 27 Donnelly Dr
- 217 Cedar Brook Rd
- 2 Anchor Rd
- 11 Pulver Dr
- 33 Rockwood Rd
Your Personal Tour Guide
Ask me questions while you tour the home.