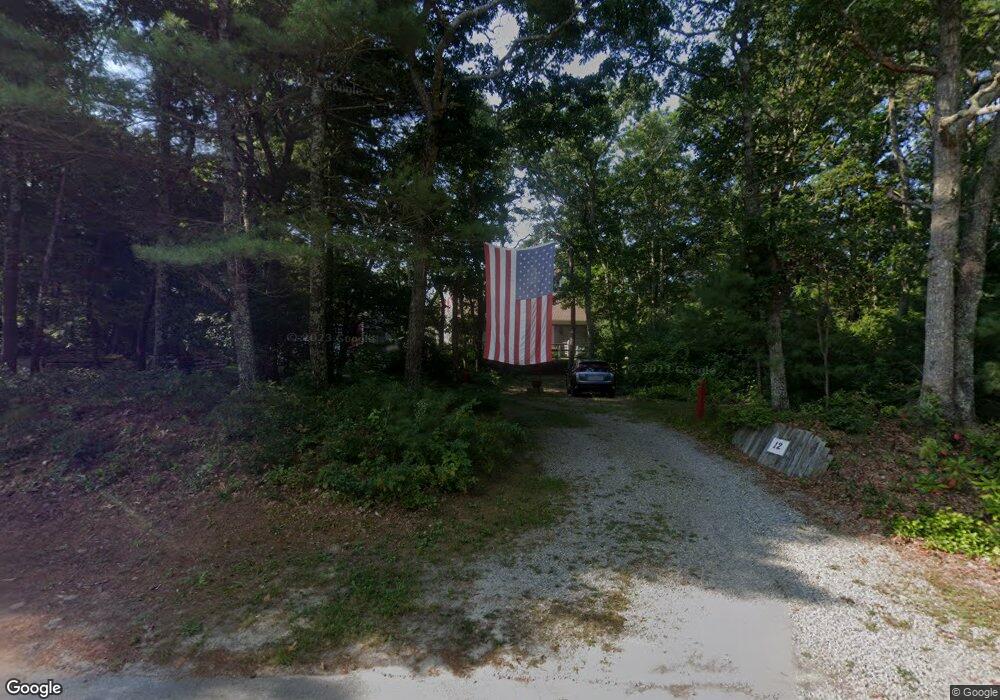
12 Tarpaulin Way Wareham, MA 02571
Estimated Value: $660,000 - $803,000
3
Beds
2
Baths
1,520
Sq Ft
$491/Sq Ft
Est. Value
About This Home
This home is located at 12 Tarpaulin Way, Wareham, MA 02571 and is currently estimated at $746,143, approximately $490 per square foot. 12 Tarpaulin Way is a home located in Plymouth County.
Ownership History
Date
Name
Owned For
Owner Type
Purchase Details
Closed on
Feb 4, 2025
Sold by
Mcdermott John R
Bought by
John R Mcdermott Ret and Mcdermott
Current Estimated Value
Purchase Details
Closed on
Nov 2, 2020
Sold by
Carey Richard A and Carey Rachel M
Bought by
Tarpaulin Nt and Walsh
Purchase Details
Closed on
May 25, 2018
Sold by
Deutsche Bk Natl T Co
Bought by
Redmond-Mcdermott John
Home Financials for this Owner
Home Financials are based on the most recent Mortgage that was taken out on this home.
Original Mortgage
$204,960
Interest Rate
4.4%
Mortgage Type
New Conventional
Purchase Details
Closed on
Nov 1, 2017
Sold by
Mannillo Richard W and Deutsche Bank Natl T C
Bought by
Deutsche Bk Natl T Co
Purchase Details
Closed on
Jan 24, 2017
Sold by
Mannillo Paula A and Deutsche Bank Natl T C
Bought by
Deutsche Bk Natl T Co
Purchase Details
Closed on
Sep 28, 1998
Sold by
Edwards June A
Bought by
Mannillo Richard W and Mannillo Paula A
Purchase Details
Closed on
Nov 29, 1993
Sold by
Edwards Craig A and Shamban Tr Stephen E
Bought by
Edward June
Create a Home Valuation Report for This Property
The Home Valuation Report is an in-depth analysis detailing your home's value as well as a comparison with similar homes in the area
Home Values in the Area
Average Home Value in this Area
Purchase History
| Date | Buyer | Sale Price | Title Company |
|---|---|---|---|
| John R Mcdermott Ret | -- | None Available | |
| John R Mcdermott Ret | -- | None Available | |
| Tarpaulin Nt | $350,000 | None Available | |
| Tarpaulin Nt | $350,000 | None Available | |
| Redmond-Mcdermott John | $256,200 | -- | |
| Redmond-Mcdermott John | $256,200 | -- | |
| Deutsche Bk Natl T Co | $345,000 | -- | |
| Deutsche Bk Natl T Co | $345,000 | -- | |
| Deutsche Bk Natl T Co | $680,326 | -- | |
| Deutsche Bk Natl T Co | $680,326 | -- | |
| Mannillo Richard W | $243,000 | -- | |
| Mannillo Richard W | $243,000 | -- | |
| Edward June | $10,000 | -- |
Source: Public Records
Mortgage History
| Date | Status | Borrower | Loan Amount |
|---|---|---|---|
| Previous Owner | Redmond-Mcdermott John | $204,960 | |
| Previous Owner | Edward June | $486,000 | |
| Previous Owner | Edward June | $50,250 |
Source: Public Records
Tax History Compared to Growth
Tax History
| Year | Tax Paid | Tax Assessment Tax Assessment Total Assessment is a certain percentage of the fair market value that is determined by local assessors to be the total taxable value of land and additions on the property. | Land | Improvement |
|---|---|---|---|---|
| 2025 | $7,104 | $681,800 | $166,700 | $515,100 |
| 2024 | $7,359 | $655,300 | $128,800 | $526,500 |
| 2023 | $6,790 | $580,400 | $117,500 | $462,900 |
| 2022 | $6,790 | $515,200 | $117,500 | $397,700 |
| 2021 | $5,993 | $445,600 | $117,500 | $328,100 |
| 2020 | $5,604 | $422,600 | $117,500 | $305,100 |
| 2019 | $5,413 | $407,300 | $121,100 | $286,200 |
| 2018 | $5,316 | $390,000 | $121,100 | $268,900 |
| 2017 | $5,177 | $384,900 | $121,100 | $263,800 |
| 2016 | $5,044 | $372,800 | $139,000 | $233,800 |
| 2015 | $4,870 | $372,600 | $139,000 | $233,600 |
| 2014 | $4,801 | $373,600 | $139,000 | $234,600 |
Source: Public Records
Map
Nearby Homes
- 10 Dowd Ave
- 65 Great Neck Rd
- 10 Over Jordan Rd
- 8 Over Jordan Rd
- 14 Over Jordan Rd
- 0 Squaw's Path
- 200 Great Neck Rd
- 13 Parkwood Dr
- 17 5th St
- 19 Datewood St
- 7 Cranberry Ln
- 6 Beacon St Unit 79
- 8 Beacon St Unit 80
- 4 Penny Ln
- 1 Gibbs Ball Park Rd
- 52 Starboard Dr Unit 36H
- 10 Beacon St Unit 83
- 9 10th St
- 26 Highland Ave
- 38 Amos Way
- 12 Tarpaulin Way
- Lot 10 Jays Way
- 10 Tarpaulin Way
- 13 Tarpaulin Way
- 15 Tarpaulin Way
- Lot 8 Jays Way
- 8 Tarpaulin Way
- 11 Tarpaulin Way
- 5 Fathom Ln
- 1 Fathom Ln
- 3 Fathom Ln
- 13 Anchorage Dr
- 6 Tarpaulin Way
- 18 Tarpaulin Way
- 18 Tarpaulin Way Unit 1
- 11 Anchorage Dr
- Lot 7 Jays Way
- 7 Tarpaulin Way
- 19 Tarpaulin Way
- 19 Tarpaulin Way Unit 1