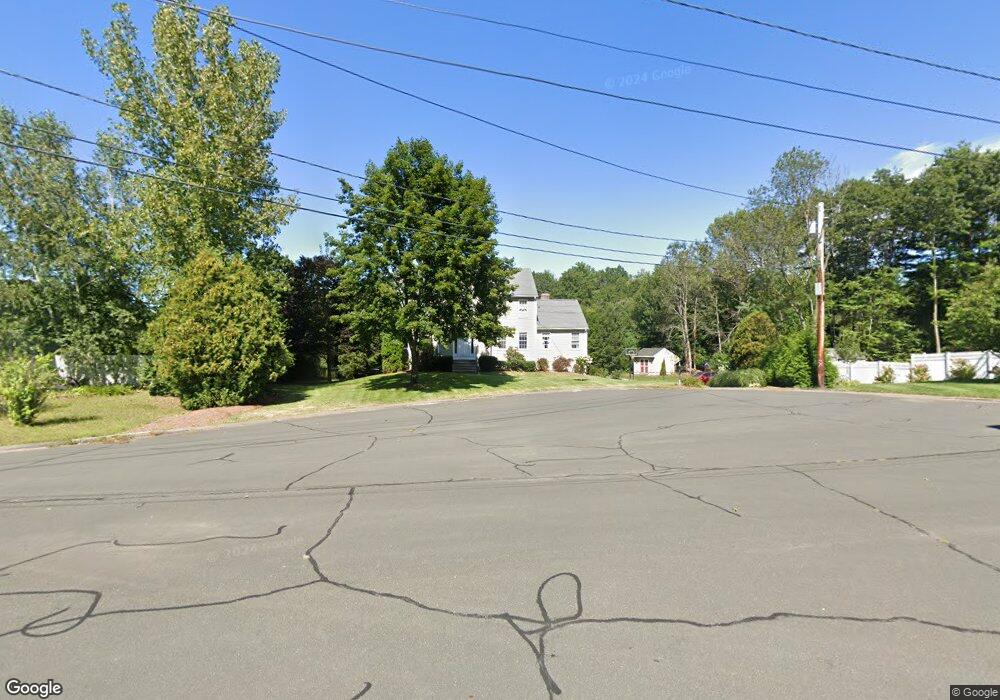
12 Taylor Rd Bellingham, MA 02019
Estimated Value: $733,197 - $998,000
4
Beds
3
Baths
2,500
Sq Ft
$333/Sq Ft
Est. Value
About This Home
This home is located at 12 Taylor Rd, Bellingham, MA 02019 and is currently estimated at $833,549, approximately $333 per square foot. 12 Taylor Rd is a home located in Norfolk County with nearby schools including Joseph F. DiPietro Elementary, Bellingham High School, and Rise Prep Mayoral Academy Middle School.
Ownership History
Date
Name
Owned For
Owner Type
Purchase Details
Closed on
Oct 23, 2025
Sold by
Shannon Gregory F and Shannon Karen
Bought by
Gregory F Shannon Ret and Shannon
Current Estimated Value
Purchase Details
Closed on
Aug 8, 2005
Sold by
Jackson Ellen K and Jackson Jeffrey J
Bought by
Shannon Gregory F and Shannon Karen
Home Financials for this Owner
Home Financials are based on the most recent Mortgage that was taken out on this home.
Original Mortgage
$353,000
Interest Rate
5.63%
Mortgage Type
Purchase Money Mortgage
Purchase Details
Closed on
Jul 27, 1999
Sold by
Devbro Dev Llc
Bought by
Jackson Jeffrey J and Jackson Ellen K
Purchase Details
Closed on
Oct 15, 1998
Sold by
Gracewood Dev Corp
Bought by
Devellis Assoc Inc
Create a Home Valuation Report for This Property
The Home Valuation Report is an in-depth analysis detailing your home's value as well as a comparison with similar homes in the area
Home Values in the Area
Average Home Value in this Area
Purchase History
| Date | Buyer | Sale Price | Title Company |
|---|---|---|---|
| Gregory F Shannon Ret | -- | -- | |
| Shannon Gregory F | $459,000 | -- | |
| Shannon Gregory F | $459,000 | -- | |
| Jackson Jeffrey J | $249,900 | -- | |
| Devellis Assoc Inc | $83,500 | -- | |
| Devellis Assoc Inc | $83,500 | -- |
Source: Public Records
Mortgage History
| Date | Status | Borrower | Loan Amount |
|---|---|---|---|
| Previous Owner | Devellis Assoc Inc | $326,000 | |
| Previous Owner | Shannon Gregory F | $353,000 | |
| Previous Owner | Shannon Gregory F | $60,000 |
Source: Public Records
Tax History Compared to Growth
Tax History
| Year | Tax Paid | Tax Assessment Tax Assessment Total Assessment is a certain percentage of the fair market value that is determined by local assessors to be the total taxable value of land and additions on the property. | Land | Improvement |
|---|---|---|---|---|
| 2025 | $7,317 | $582,600 | $175,400 | $407,200 |
| 2024 | $6,987 | $543,300 | $160,100 | $383,200 |
| 2023 | $6,732 | $515,900 | $152,500 | $363,400 |
| 2022 | $6,646 | $472,000 | $130,000 | $342,000 |
| 2021 | $6,414 | $445,100 | $130,000 | $315,100 |
| 2020 | $6,140 | $431,800 | $130,000 | $301,800 |
| 2019 | $6,002 | $422,400 | $130,000 | $292,400 |
| 2018 | $5,721 | $397,000 | $126,500 | $270,500 |
| 2017 | $5,495 | $383,200 | $126,500 | $256,700 |
| 2016 | $5,370 | $375,800 | $135,200 | $240,600 |
| 2015 | $5,150 | $361,400 | $130,000 | $231,400 |
| 2014 | $5,168 | $352,500 | $127,400 | $225,100 |
Source: Public Records
Map
Nearby Homes