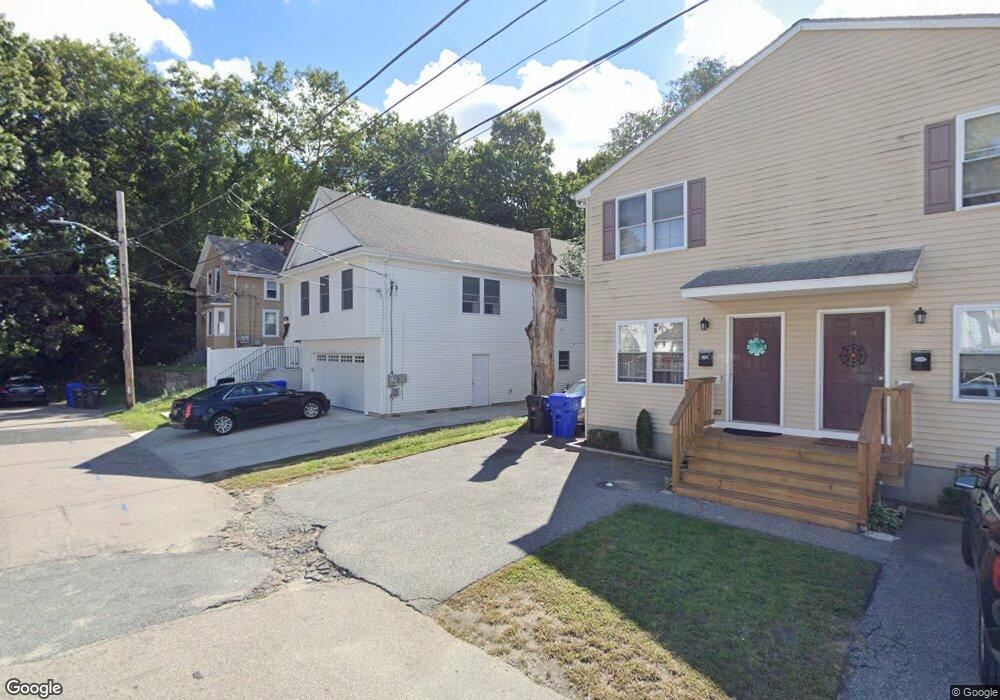
12 Thomas Ave Pawtucket, RI 02860
Fairlawn NeighborhoodEstimated Value: $412,000 - $499,587
4
Beds
2
Baths
2,784
Sq Ft
$168/Sq Ft
Est. Value
About This Home
This home is located at 12 Thomas Ave, Pawtucket, RI 02860 and is currently estimated at $466,897, approximately $167 per square foot. 12 Thomas Ave is a home with nearby schools including Blackstone Valley Prep Upper Elementary School, Blackstone Valley Prep Junior High School, and Bishop Keough Regional High School.
Ownership History
Date
Name
Owned For
Owner Type
Purchase Details
Closed on
Sep 3, 2021
Sold by
Kyltiff Invs & Consulting
Bought by
Elderkin Rodney and Elderkin Aaron
Current Estimated Value
Home Financials for this Owner
Home Financials are based on the most recent Mortgage that was taken out on this home.
Original Mortgage
$352,497
Outstanding Balance
$317,421
Interest Rate
2.7%
Mortgage Type
FHA
Estimated Equity
$149,476
Purchase Details
Closed on
Jul 23, 2019
Sold by
Walter King Ent Llc
Bought by
Kyltiff Inv & Consult Llc
Home Financials for this Owner
Home Financials are based on the most recent Mortgage that was taken out on this home.
Original Mortgage
$170,000
Interest Rate
3.82%
Mortgage Type
Commercial
Purchase Details
Closed on
Dec 30, 2015
Sold by
Fehu Llc
Bought by
Jutonus Llc
Create a Home Valuation Report for This Property
The Home Valuation Report is an in-depth analysis detailing your home's value as well as a comparison with similar homes in the area
Home Values in the Area
Average Home Value in this Area
Purchase History
| Date | Buyer | Sale Price | Title Company |
|---|---|---|---|
| Elderkin Rodney | $359,000 | None Available | |
| Kyltiff Inv & Consult Llc | $62,500 | -- | |
| Jutonus Llc | -- | -- |
Source: Public Records
Mortgage History
| Date | Status | Borrower | Loan Amount |
|---|---|---|---|
| Open | Elderkin Rodney | $352,497 | |
| Previous Owner | Kyltiff Inv & Consult Llc | $170,000 |
Source: Public Records
Tax History
| Year | Tax Paid | Tax Assessment Tax Assessment Total Assessment is a certain percentage of the fair market value that is determined by local assessors to be the total taxable value of land and additions on the property. | Land | Improvement |
|---|---|---|---|---|
| 2025 | $5,548 | $421,900 | $127,400 | $294,500 |
| 2024 | $5,206 | $421,900 | $127,400 | $294,500 |
| 2023 | $4,955 | $292,500 | $69,400 | $223,100 |
| 2022 | $4,850 | $292,500 | $69,400 | $223,100 |
| 2021 | $4,850 | $292,500 | $69,400 | $223,100 |
| 2020 | $1,337 | $64,000 | $64,000 | $0 |
| 2019 | $1,337 | $64,000 | $64,000 | $0 |
| 2018 | $1,288 | $64,000 | $64,000 | $0 |
| 2017 | $1,329 | $58,500 | $58,500 | $0 |
| 2016 | $1,281 | $58,500 | $58,500 | $0 |
| 2015 | $1,281 | $58,500 | $58,500 | $0 |
| 2014 | $1,349 | $58,500 | $58,500 | $0 |
Source: Public Records
Map
Nearby Homes
Your Personal Tour Guide
Ask me questions while you tour the home.