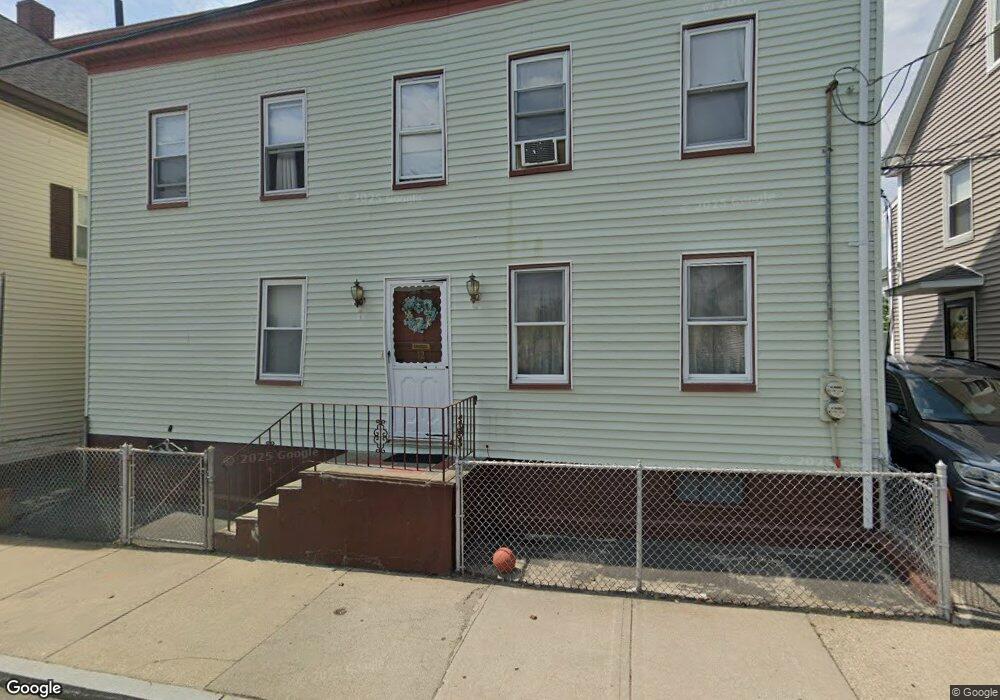
12 Tracey St Peabody, MA 01960
Peabody Town Center NeighborhoodEstimated Value: $699,000 - $851,000
4
Beds
3
Baths
2,268
Sq Ft
$351/Sq Ft
Est. Value
About This Home
This home is located at 12 Tracey St, Peabody, MA 01960 and is currently estimated at $796,000, approximately $350 per square foot. 12 Tracey St is a home located in Essex County with nearby schools including Peabody Veterans Memorial High School, St John The Baptist School, and The Phoenix School.
Ownership History
Date
Name
Owned For
Owner Type
Purchase Details
Closed on
Sep 29, 2025
Sold by
Dasilva Lisa M and Silva Manuel F
Bought by
12 Tracey St Peabody Rt and Dasilva
Current Estimated Value
Purchase Details
Closed on
Jan 26, 1972
Bought by
Silva Emilda C
Create a Home Valuation Report for This Property
The Home Valuation Report is an in-depth analysis detailing your home's value as well as a comparison with similar homes in the area
Home Values in the Area
Average Home Value in this Area
Purchase History
| Date | Buyer | Sale Price | Title Company |
|---|---|---|---|
| 12 Tracey St Peabody Rt | -- | -- | |
| Dasilva Lisa M | -- | -- | |
| Silva Emilda C | -- | -- |
Source: Public Records
Mortgage History
| Date | Status | Borrower | Loan Amount |
|---|---|---|---|
| Previous Owner | Silva Emilda C | $70,000 | |
| Previous Owner | Silva Emilda C | $40,000 | |
| Previous Owner | Silva Emilda C | $70,000 |
Source: Public Records
Tax History Compared to Growth
Tax History
| Year | Tax Paid | Tax Assessment Tax Assessment Total Assessment is a certain percentage of the fair market value that is determined by local assessors to be the total taxable value of land and additions on the property. | Land | Improvement |
|---|---|---|---|---|
| 2025 | $5,890 | $636,100 | $190,300 | $445,800 |
| 2024 | $5,322 | $583,600 | $190,300 | $393,300 |
| 2023 | $4,882 | $512,800 | $165,500 | $347,300 |
| 2022 | $4,763 | $471,600 | $147,800 | $323,800 |
| 2021 | $4,582 | $436,800 | $134,300 | $302,500 |
| 2020 | $4,487 | $417,800 | $134,300 | $283,500 |
| 2019 | $4,380 | $397,800 | $134,300 | $263,500 |
| 2018 | $3,576 | $312,000 | $126,700 | $185,300 |
| 2017 | $3,456 | $293,900 | $126,700 | $167,200 |
| 2016 | $3,335 | $279,800 | $126,700 | $153,100 |
| 2015 | $3,186 | $259,000 | $126,700 | $132,300 |
Source: Public Records
Map
Nearby Homes