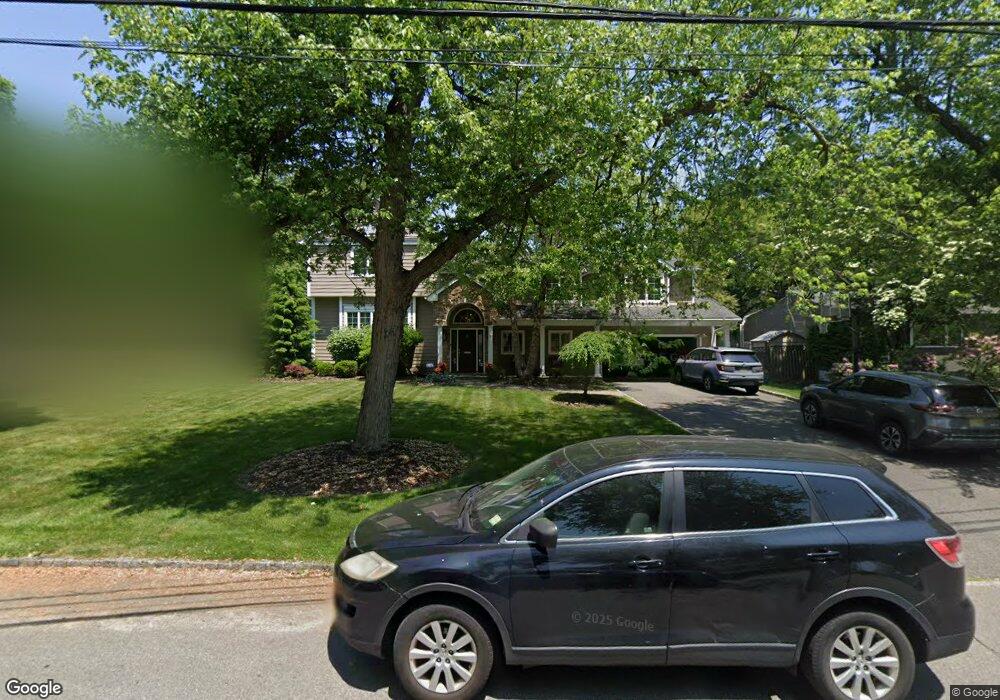
12 Tuxedo Dr Livingston, NJ 07039
Estimated Value: $1,607,000 - $2,156,000
--
Bed
--
Bath
3,616
Sq Ft
$510/Sq Ft
Est. Value
About This Home
This home is located at 12 Tuxedo Dr, Livingston, NJ 07039 and is currently estimated at $1,844,755, approximately $510 per square foot. 12 Tuxedo Dr is a home located in Essex County with nearby schools including Livingston Sr High School and Aquinas Academy.
Ownership History
Date
Name
Owned For
Owner Type
Purchase Details
Closed on
Jan 20, 2011
Sold by
Caruso John F and Caruso Melissa
Bought by
Caruso John F and Caruso Melissa
Current Estimated Value
Purchase Details
Closed on
May 26, 1999
Sold by
Aronson Joel
Bought by
Caruso John and Caruso Melissa
Home Financials for this Owner
Home Financials are based on the most recent Mortgage that was taken out on this home.
Original Mortgage
$268,000
Interest Rate
7.6%
Create a Home Valuation Report for This Property
The Home Valuation Report is an in-depth analysis detailing your home's value as well as a comparison with similar homes in the area
Home Values in the Area
Average Home Value in this Area
Purchase History
| Date | Buyer | Sale Price | Title Company |
|---|---|---|---|
| Caruso John F | -- | None Available | |
| Caruso John | -- | None Available | |
| Caruso John | $335,000 | -- |
Source: Public Records
Mortgage History
| Date | Status | Borrower | Loan Amount |
|---|---|---|---|
| Previous Owner | Caruso John | $268,000 |
Source: Public Records
Tax History Compared to Growth
Tax History
| Year | Tax Paid | Tax Assessment Tax Assessment Total Assessment is a certain percentage of the fair market value that is determined by local assessors to be the total taxable value of land and additions on the property. | Land | Improvement |
|---|---|---|---|---|
| 2025 | $23,777 | $1,002,400 | $398,400 | $604,000 |
| 2024 | $23,777 | $1,002,400 | $398,400 | $604,000 |
| 2022 | $23,386 | $1,002,400 | $398,400 | $604,000 |
| 2021 | $23,196 | $1,002,400 | $398,400 | $604,000 |
| 2020 | $22,765 | $1,002,400 | $398,400 | $604,000 |
| 2019 | $20,865 | $797,600 | $368,900 | $428,700 |
| 2018 | $20,586 | $797,600 | $368,900 | $428,700 |
| 2017 | $20,315 | $797,600 | $368,900 | $428,700 |
| 2016 | $19,940 | $797,600 | $368,900 | $428,700 |
| 2015 | $19,645 | $797,600 | $368,900 | $428,700 |
| 2014 | $19,007 | $797,600 | $368,900 | $428,700 |
Source: Public Records
Map
Nearby Homes