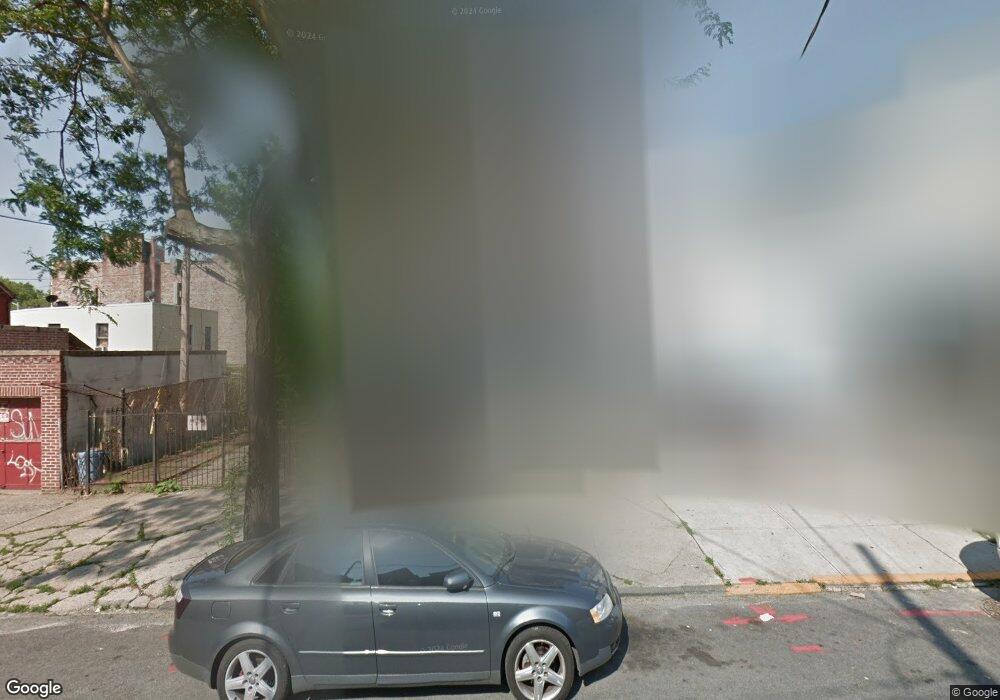
12 van Siclen Ave Brooklyn, NY 11207
Cypress Hills NeighborhoodEstimated Value: $653,000 - $913,000
--
Bed
--
Bath
1,638
Sq Ft
$480/Sq Ft
Est. Value
About This Home
This home is located at 12 van Siclen Ave, Brooklyn, NY 11207 and is currently estimated at $785,433, approximately $479 per square foot. 12 van Siclen Ave is a home located in Kings County with nearby schools including P.S. 290 - Juan Morel Campos, Liberty Avenue Middle School, and Vista Academy.
Ownership History
Date
Name
Owned For
Owner Type
Purchase Details
Closed on
May 28, 2019
Sold by
Estate Of Doctor Raymond Dobson
Bought by
Moore Valerie
Current Estimated Value
Purchase Details
Closed on
May 10, 2001
Sold by
Plaza Homes Llc
Bought by
Dobson Ray
Home Financials for this Owner
Home Financials are based on the most recent Mortgage that was taken out on this home.
Original Mortgage
$175,200
Interest Rate
7.09%
Purchase Details
Closed on
Jul 9, 1996
Sold by
Medina Maria and Lara Raul
Bought by
Medina Maria and Betances Elsa
Home Financials for this Owner
Home Financials are based on the most recent Mortgage that was taken out on this home.
Original Mortgage
$120,000
Interest Rate
8.4%
Purchase Details
Closed on
Feb 6, 1996
Sold by
Lara Raul and Medina Andrea
Bought by
Lara Raul and Medina Andrea
Create a Home Valuation Report for This Property
The Home Valuation Report is an in-depth analysis detailing your home's value as well as a comparison with similar homes in the area
Home Values in the Area
Average Home Value in this Area
Purchase History
| Date | Buyer | Sale Price | Title Company |
|---|---|---|---|
| Moore Valerie | -- | -- | |
| Moore Valerie | -- | -- | |
| Moore Valerie | -- | -- | |
| Dobson Ray | -- | -- | |
| Dobson Ray | -- | -- | |
| Medina Maria | $120,000 | Chicago Title Insurance Co | |
| Medina Maria | -- | Chicago Title Insurance Co | |
| Lara Raul | -- | -- | |
| Lara Raul | -- | -- |
Source: Public Records
Mortgage History
| Date | Status | Borrower | Loan Amount |
|---|---|---|---|
| Previous Owner | Dobson Ray | $175,200 | |
| Previous Owner | Medina Maria | $120,000 |
Source: Public Records
Tax History Compared to Growth
Tax History
| Year | Tax Paid | Tax Assessment Tax Assessment Total Assessment is a certain percentage of the fair market value that is determined by local assessors to be the total taxable value of land and additions on the property. | Land | Improvement |
|---|---|---|---|---|
| 2025 | $4,691 | $52,440 | $14,940 | $37,500 |
| 2024 | $4,691 | $52,560 | $14,940 | $37,620 |
| 2023 | $4,700 | $46,440 | $14,940 | $31,500 |
| 2022 | $4,363 | $45,120 | $14,940 | $30,180 |
| 2021 | $4,342 | $43,860 | $14,940 | $28,920 |
| 2020 | $3,257 | $35,580 | $14,940 | $20,640 |
| 2019 | $4,072 | $35,580 | $14,940 | $20,640 |
| 2018 | $3,931 | $19,286 | $6,792 | $12,494 |
| 2017 | $3,713 | $18,212 | $8,336 | $9,876 |
| 2016 | $3,437 | $17,193 | $10,623 | $6,570 |
| 2015 | $1,852 | $16,221 | $11,013 | $5,208 |
| 2014 | $1,852 | $16,221 | $12,177 | $4,044 |
Source: Public Records
Map
Nearby Homes
- 14 van Siclen Ct
- 48 van Siclen Ave
- 52 van Siclen Ave
- 3 Schenck Ct
- 133 Sunnyside Ave
- 224 Highland Blvd Unit 710
- 87 Schenck Ave
- 107 Miller Ave
- 153 Hendrix St
- 171 Arlington Ave
- 178 Highland Blvd
- 33 Jerome St
- 2830 Fulton St
- 126 Jerome St
- 52 Bradford St
- 168 Warwick St
- 2735 Fulton St
- 2880 Fulton St
- 57 Wyona St
- 153 Highland Blvd
- 8 Van Sicklen St
- 198 Jamaica Ave
- 67 Arlington Ave
- 69 Arlington Ave
- 63 Arlington Ave
- 196 Jamaica Ave
- 202 Jamaica Ave
- 61 Arlington Ave
- 61 Arlington Ave Unit 2
- 194 Jamaica Ave
- 194/196 Jamaica Ave
- 192 Jamaica Ave
- 59 Arlington Ave
- 59 Arlington Ave Unit 3
- 59 Arlington Ave Unit 2
- 59 Arlington Ave Unit 1
- 190 Jamaica Ave
- 55 Arlington Ave
- 55 Arlington Ave Unit 3R
- 188 Jamaica Ave