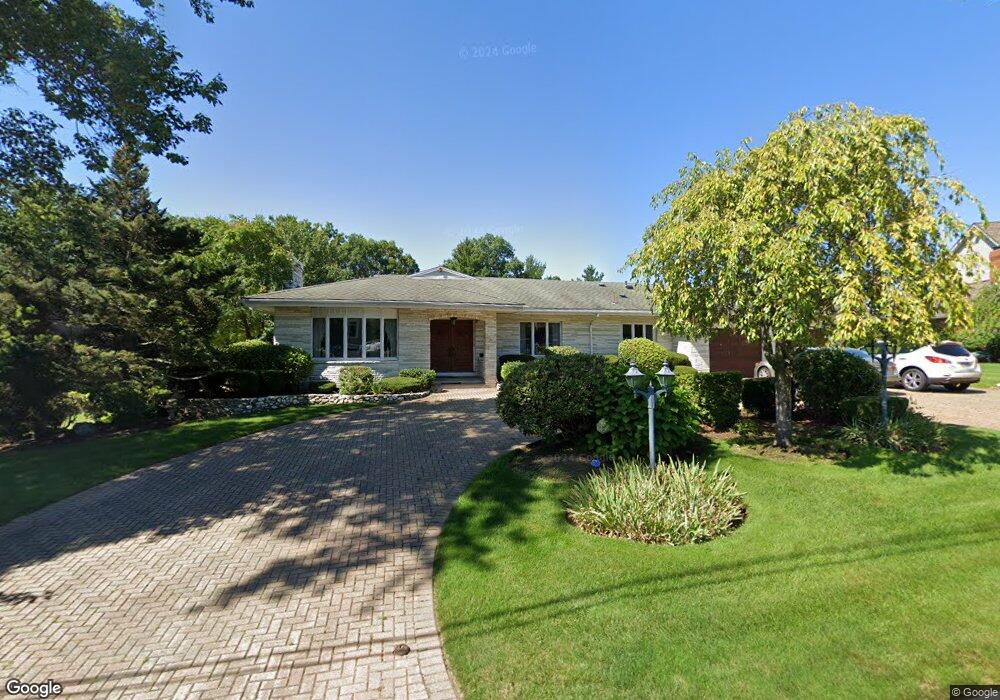
12 Vinson Cir Winchester, MA 01890
West Side NeighborhoodEstimated Value: $1,861,000 - $2,271,000
3
Beds
5
Baths
5,433
Sq Ft
$392/Sq Ft
Est. Value
About This Home
This home is located at 12 Vinson Cir, Winchester, MA 01890 and is currently estimated at $2,129,318, approximately $391 per square foot. 12 Vinson Cir is a home located in Middlesex County with nearby schools including Vinson-Owen Elementary School, McCall Middle School, and Winchester High School.
Ownership History
Date
Name
Owned For
Owner Type
Purchase Details
Closed on
Jul 9, 2013
Sold by
Pawlak Katherine G and Pawlak Robert A
Bought by
Pawlak Nt
Current Estimated Value
Purchase Details
Closed on
Feb 25, 2013
Sold by
Pawlak Nt
Bought by
Pawlak Katherine G and Pawlak Robert A
Purchase Details
Closed on
Apr 5, 2012
Sold by
Pawlak Robert A and Pawlak Katherine G
Bought by
Pawlak Nt
Purchase Details
Closed on
Mar 30, 2011
Sold by
Pawlak Nt
Bought by
Pawlak Robert A and Pawlak Kathrine G
Home Financials for this Owner
Home Financials are based on the most recent Mortgage that was taken out on this home.
Original Mortgage
$350,000
Interest Rate
4.76%
Purchase Details
Closed on
Jul 18, 2000
Sold by
Piantedosi Elaine
Bought by
Pawlak Nt
Create a Home Valuation Report for This Property
The Home Valuation Report is an in-depth analysis detailing your home's value as well as a comparison with similar homes in the area
Home Values in the Area
Average Home Value in this Area
Purchase History
| Date | Buyer | Sale Price | Title Company |
|---|---|---|---|
| Pawlak Nt | -- | -- | |
| Pawlak Katherine G | -- | -- | |
| Pawlak Nt | -- | -- | |
| Pawlak Robert A | -- | -- | |
| Pawlak Nt | $999,000 | -- |
Source: Public Records
Mortgage History
| Date | Status | Borrower | Loan Amount |
|---|---|---|---|
| Previous Owner | Pawlak Nt | $350,000 | |
| Previous Owner | Pawlak Robert A | $417,000 |
Source: Public Records
Tax History Compared to Growth
Tax History
| Year | Tax Paid | Tax Assessment Tax Assessment Total Assessment is a certain percentage of the fair market value that is determined by local assessors to be the total taxable value of land and additions on the property. | Land | Improvement |
|---|---|---|---|---|
| 2025 | $201 | $1,809,600 | $1,001,800 | $807,800 |
| 2024 | $19,371 | $1,709,700 | $921,800 | $787,900 |
| 2023 | $17,843 | $1,512,100 | $761,800 | $750,300 |
| 2022 | $18,496 | $1,478,500 | $701,600 | $776,900 |
| 2021 | $17,686 | $1,378,500 | $601,600 | $776,900 |
| 2020 | $17,080 | $1,378,500 | $601,600 | $776,900 |
| 2019 | $16,209 | $1,338,500 | $561,600 | $776,900 |
| 2018 | $15,580 | $1,278,100 | $516,600 | $761,500 |
| 2017 | $15,829 | $1,289,000 | $516,600 | $772,400 |
| 2016 | $14,511 | $1,242,400 | $516,600 | $725,800 |
| 2015 | $14,281 | $1,176,400 | $450,600 | $725,800 |
| 2014 | $14,311 | $1,130,400 | $431,600 | $698,800 |
Source: Public Records
Map
Nearby Homes