Estimated Value: $455,000 - $505,000
5
Beds
3
Baths
1,428
Sq Ft
$336/Sq Ft
Est. Value
About This Home
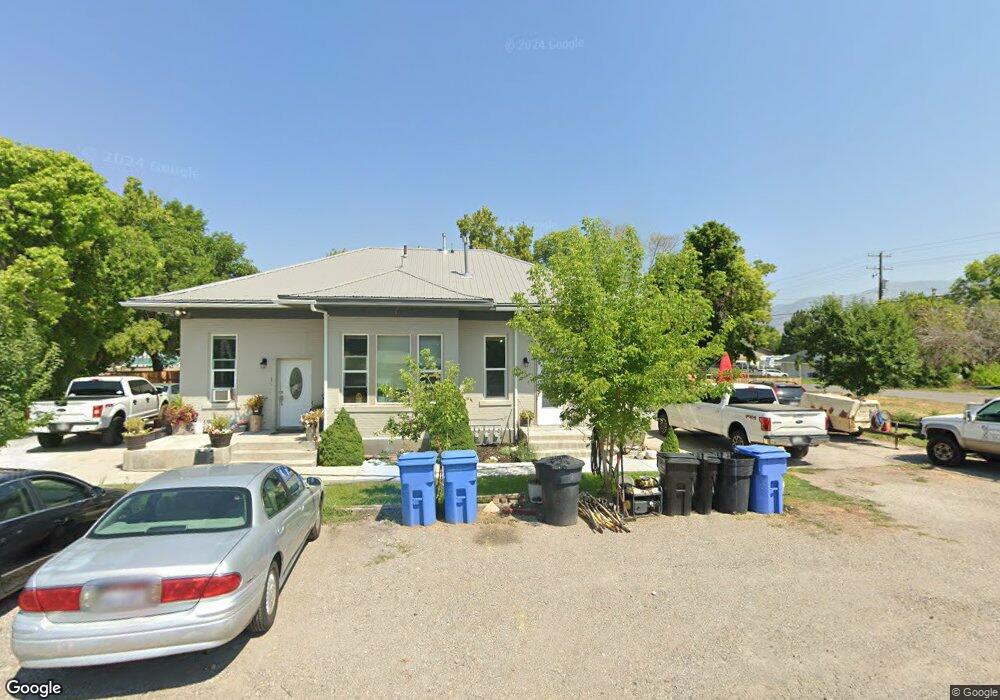
This home is located at 12 W 100 N, Hyrum, UT 84319 and is currently estimated at $480,000, approximately $336 per square foot. 12 W 100 N is a home located in Cache County with nearby schools including Lincoln School, South Cache Middle School, and Mountain Crest High School.
Ownership History
Date
Name
Owned For
Owner Type
Purchase Details
Closed on
Jan 17, 2012
Sold by
Nava Israel Mendez
Bought by
Silva Susana
Current Estimated Value
Home Financials for this Owner
Home Financials are based on the most recent Mortgage that was taken out on this home.
Original Mortgage
$76,586
Outstanding Balance
$52,062
Interest Rate
3.88%
Mortgage Type
Purchase Money Mortgage
Estimated Equity
$427,938
Purchase Details
Closed on
Jun 16, 2009
Sold by
Bindrup Troy
Bought by
Todos Santos Estates Llc
Create a Home Valuation Report for This Property
The Home Valuation Report is an in-depth analysis detailing your home's value as well as a comparison with similar homes in the area
Home Values in the Area
Average Home Value in this Area
Purchase History
| Date | Buyer | Sale Price | Title Company |
|---|---|---|---|
| Silva Susana | -- | Pinnacle Title Ins Agency | |
| Todos Santos Estates Llc | -- | Pinnacle Title Ins Agency |
Source: Public Records
Mortgage History
| Date | Status | Borrower | Loan Amount |
|---|---|---|---|
| Open | Silva Susana | $76,586 |
Source: Public Records
Tax History Compared to Growth
Tax History
| Year | Tax Paid | Tax Assessment Tax Assessment Total Assessment is a certain percentage of the fair market value that is determined by local assessors to be the total taxable value of land and additions on the property. | Land | Improvement |
|---|---|---|---|---|
| 2025 | $1,544 | $403,020 | $185,000 | $218,020 |
| 2024 | $1,653 | $403,020 | $185,000 | $218,020 |
| 2023 | $1,450 | $338,020 | $120,000 | $218,020 |
| 2022 | $1,513 | $338,020 | $120,000 | $218,020 |
| 2021 | $1,681 | $318,200 | $120,000 | $198,200 |
| 2020 | $1,033 | $183,400 | $80,000 | $103,400 |
| 2019 | $1,098 | $183,400 | $80,000 | $103,400 |
| 2018 | $1,128 | $182,130 | $60,000 | $122,130 |
| 2017 | $946 | $79,310 | $0 | $0 |
| 2016 | $968 | $62,865 | $0 | $0 |
| 2015 | $769 | $62,865 | $0 | $0 |
| 2014 | $750 | $62,700 | $0 | $0 |
| 2013 | $524 | $62,700 | $0 | $0 |
Source: Public Records
Map
Nearby Homes