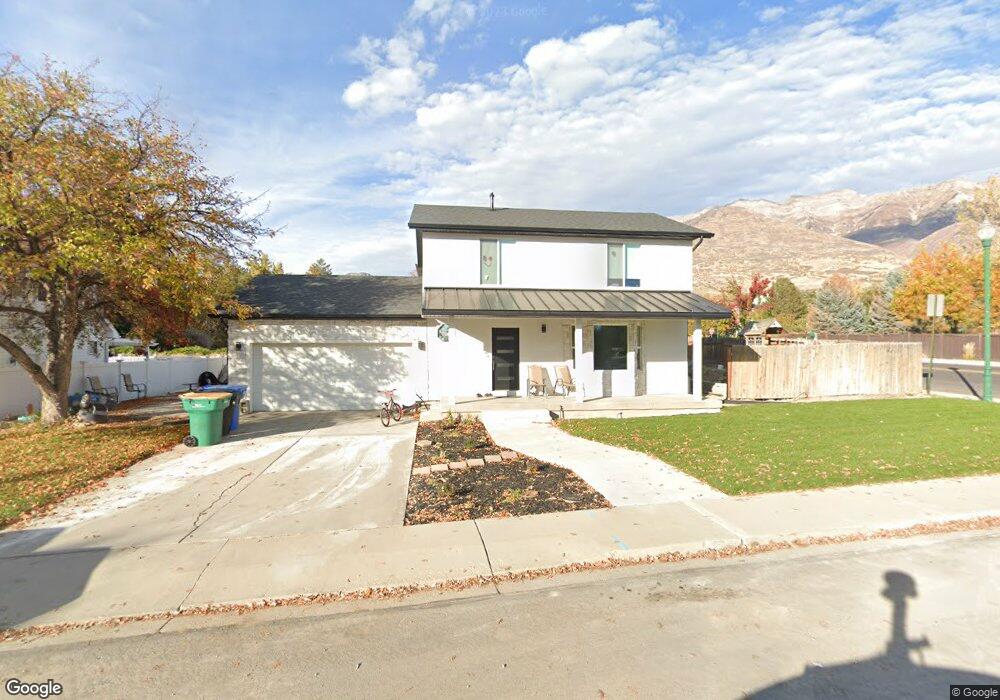
12 W 1780 N Orem, UT 84057
Northridge NeighborhoodEstimated Value: $585,000 - $713,000
5
Beds
3
Baths
2,282
Sq Ft
$283/Sq Ft
Est. Value
About This Home
This home is located at 12 W 1780 N, Orem, UT 84057 and is currently estimated at $645,539, approximately $282 per square foot. 12 W 1780 N is a home located in Utah County with nearby schools including Northridge Elementary School, Oak Canyon Junior High School, and Timpanogos High School.
Ownership History
Date
Name
Owned For
Owner Type
Purchase Details
Closed on
Mar 15, 2022
Sold by
Jonathan Allred
Bought by
Allred Jonathan and Allred Amy
Current Estimated Value
Home Financials for this Owner
Home Financials are based on the most recent Mortgage that was taken out on this home.
Original Mortgage
$200,000
Outstanding Balance
$184,649
Interest Rate
3.55%
Mortgage Type
Credit Line Revolving
Estimated Equity
$460,890
Purchase Details
Closed on
Feb 24, 2009
Sold by
Wendel Rob and Wendel Brad
Bought by
Allred Jonathan and Allred Amy
Home Financials for this Owner
Home Financials are based on the most recent Mortgage that was taken out on this home.
Original Mortgage
$235,551
Interest Rate
4.91%
Mortgage Type
FHA
Purchase Details
Closed on
Feb 14, 2008
Sold by
Jensen Mark F and Jensen Ladonna R
Bought by
Wendel Rob and Wendel Brad
Purchase Details
Closed on
Jul 17, 1998
Sold by
Jensen Ladonna R
Bought by
Jensen Mark F
Home Financials for this Owner
Home Financials are based on the most recent Mortgage that was taken out on this home.
Original Mortgage
$140,800
Interest Rate
7%
Create a Home Valuation Report for This Property
The Home Valuation Report is an in-depth analysis detailing your home's value as well as a comparison with similar homes in the area
Home Values in the Area
Average Home Value in this Area
Purchase History
| Date | Buyer | Sale Price | Title Company |
|---|---|---|---|
| Allred Jonathan | -- | Vanguard Title | |
| Allred Jonathan | -- | Vanguard Title | |
| Allred Jonathan | -- | Title West Title Company | |
| Wendel Rob | -- | Inwest Title Services Inc | |
| Jensen Mark F | -- | Empire Land Title Inc |
Source: Public Records
Mortgage History
| Date | Status | Borrower | Loan Amount |
|---|---|---|---|
| Open | Allred Jonathan | $200,000 | |
| Previous Owner | Allred Jonathan | $235,551 | |
| Previous Owner | Jensen Mark F | $140,800 |
Source: Public Records
Tax History
| Year | Tax Paid | Tax Assessment Tax Assessment Total Assessment is a certain percentage of the fair market value that is determined by local assessors to be the total taxable value of land and additions on the property. | Land | Improvement |
|---|---|---|---|---|
| 2025 | $2,363 | $328,350 | -- | -- |
| 2024 | $2,363 | $288,915 | $0 | $0 |
| 2023 | $2,123 | $279,015 | $0 | $0 |
| 2022 | $2,099 | $267,190 | $0 | $0 |
| 2021 | $1,828 | $352,500 | $156,800 | $195,700 |
| 2020 | $1,674 | $317,300 | $125,400 | $191,900 |
| 2019 | $1,483 | $292,300 | $125,400 | $166,900 |
| 2018 | $1,448 | $272,600 | $118,300 | $154,300 |
| 2017 | $1,290 | $130,130 | $0 | $0 |
| 2016 | $1,374 | $127,820 | $0 | $0 |
| 2015 | $1,440 | $126,665 | $0 | $0 |
| 2014 | $1,316 | $115,280 | $0 | $0 |
Source: Public Records
Map
Nearby Homes
- 49 W 1880 N
- 1744 N 280 W
- 1638 N 160 E
- 1636 N 160 E
- 1547 N 275 West St Unit 5
- 1566 N 275 West St Unit 1
- 1548 N 275 West St Unit 2
- 1916 N 430 W
- 127 S 400 E
- 14 N 850 E
- 1461 N Amiron Way Unit B
- 332 W Amiron Way Unit D
- 287 W 1380 N
- 363 E 1395 N Unit 22
- 1480 N 430 E
- 1371 N 330 E Unit 8
- 1545 N State St Unit 1
- 512 W 1450 N
- 540 E Quail Rd
- 527 W 1450 N
Your Personal Tour Guide
Ask me questions while you tour the home.